Status by task
| Task | Status | Where it stands |
|---|---|---|
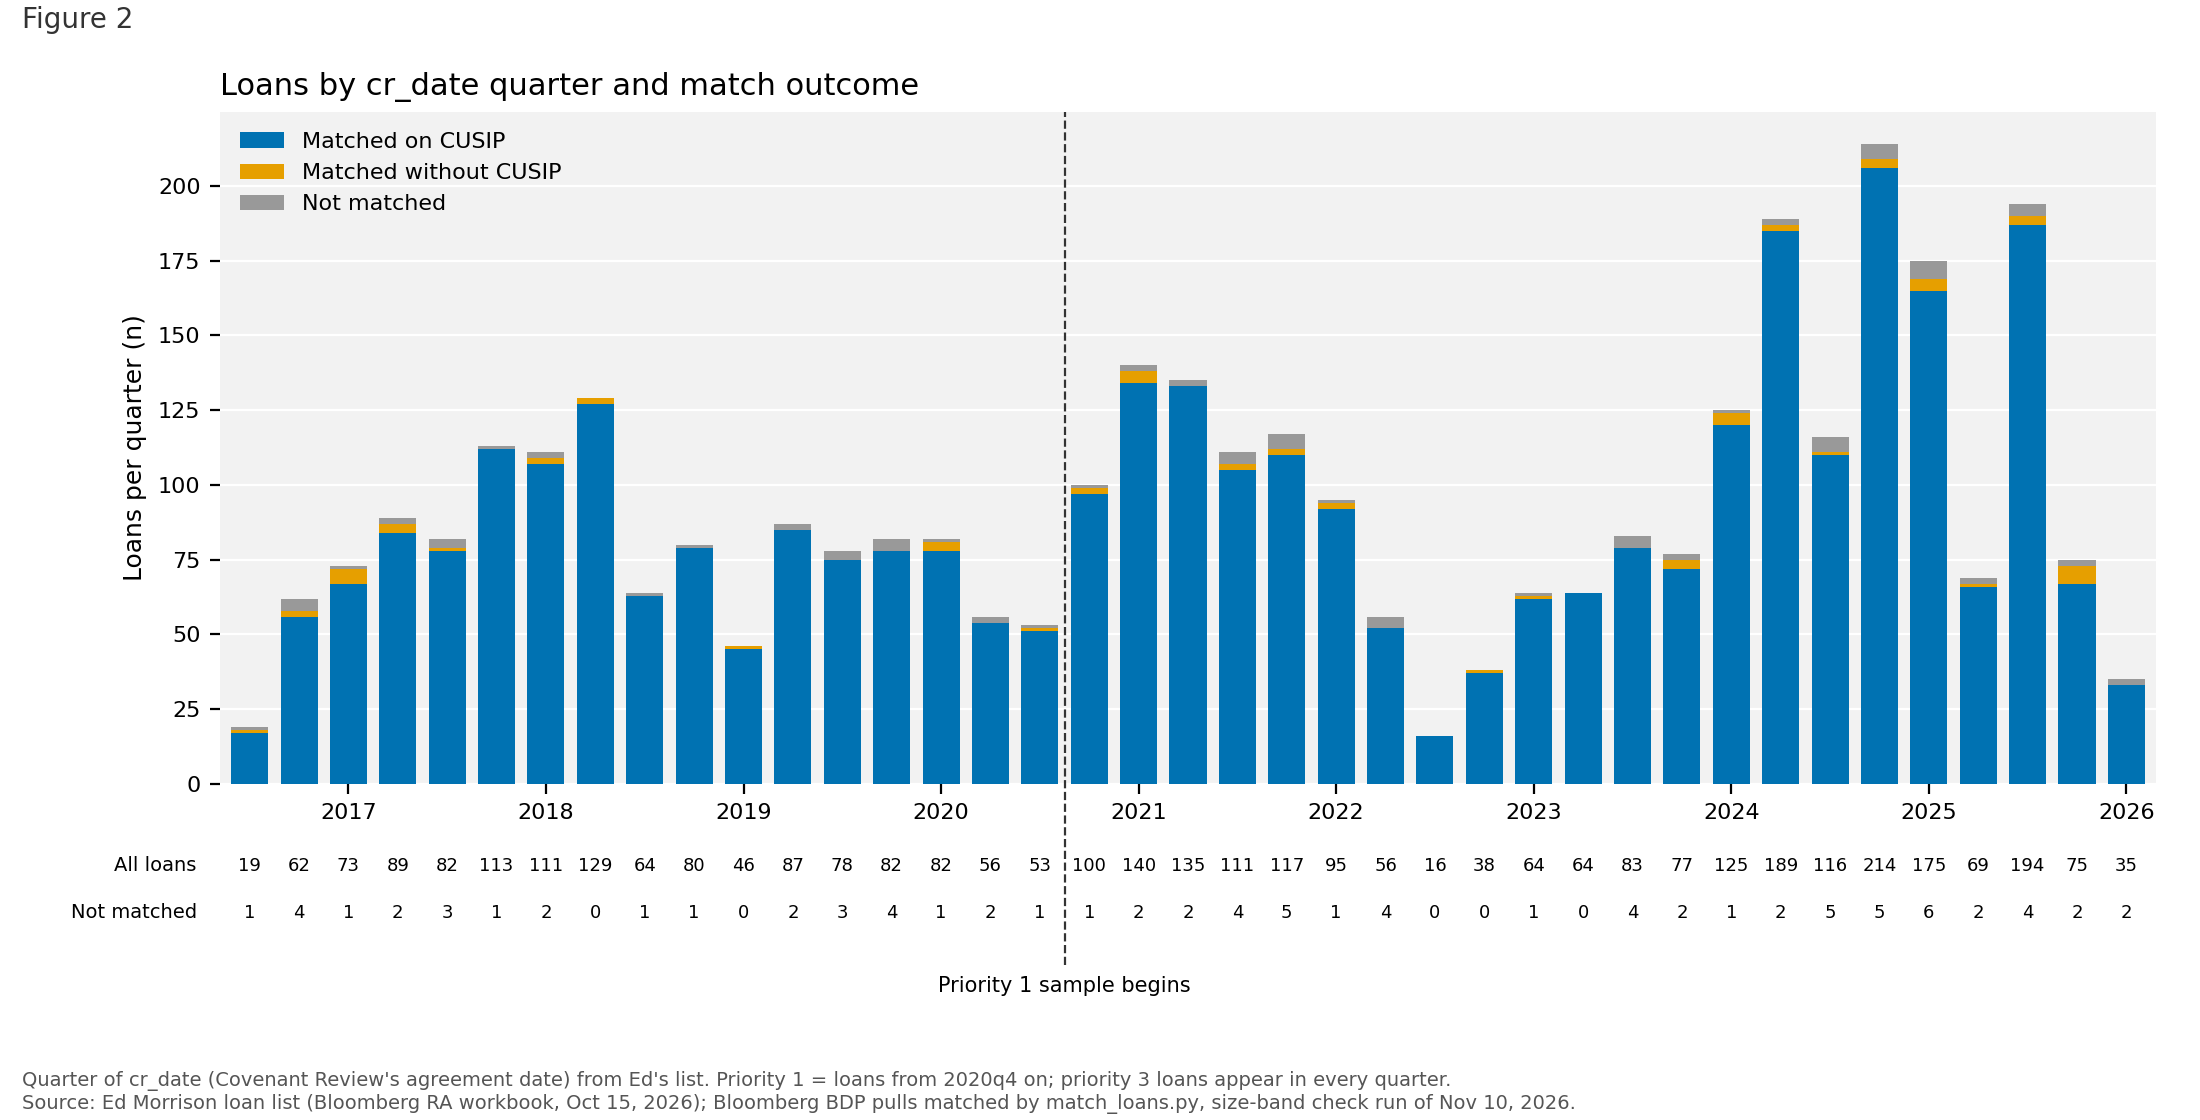
| Task 1: loan dates | Complete | 3,594 loans; 3,510 matched, 84 not matched. |
| Task 2: CLO AAA tranches | Complete | 38,534 CUSIPs, issued Nov 2015 to Nov 10, 2026. |
| Task 3: daily market series | In progress | Series built; issuance series still on the S&P-only list; series files and log to do. |
| Task 4: report | Not started | One-page report. |
| Task 5: loan prices | Complete | BVAL prices; phase 1 98.6% of loans priced, phase 2 91.5%. |
Click any figure to open it full size.
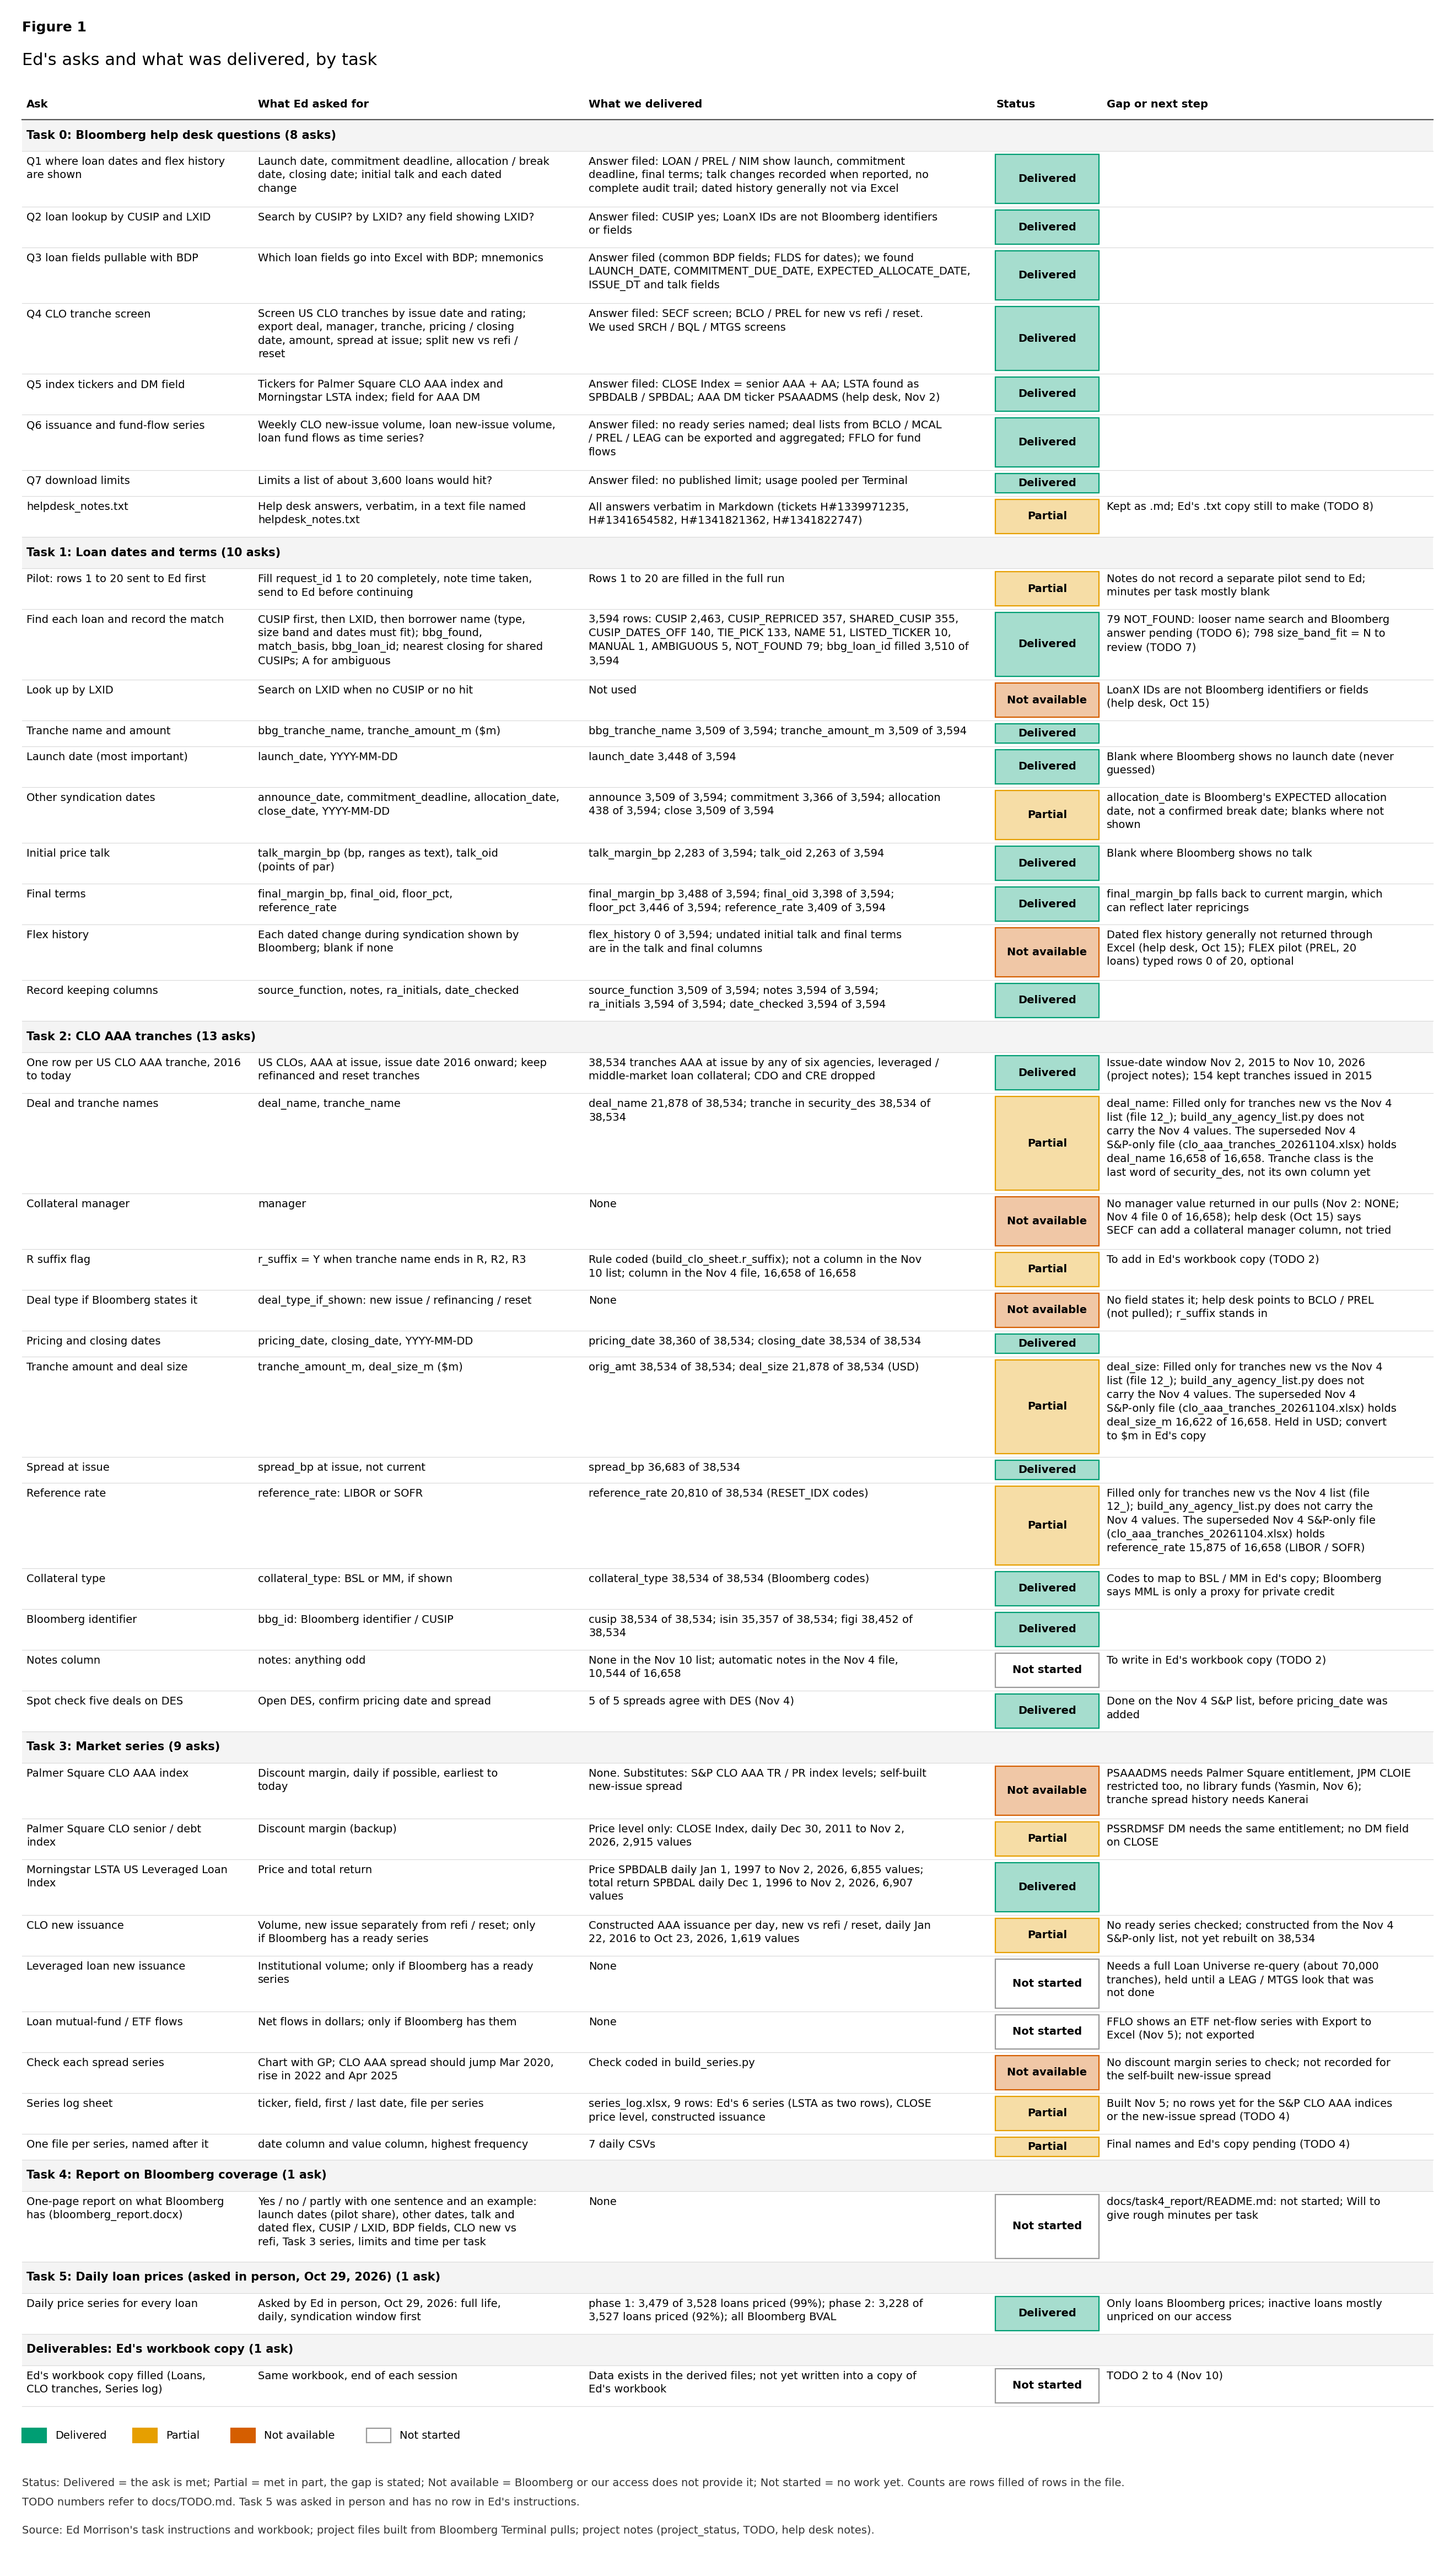
Asked vs delivered
Asked vs delivered chart
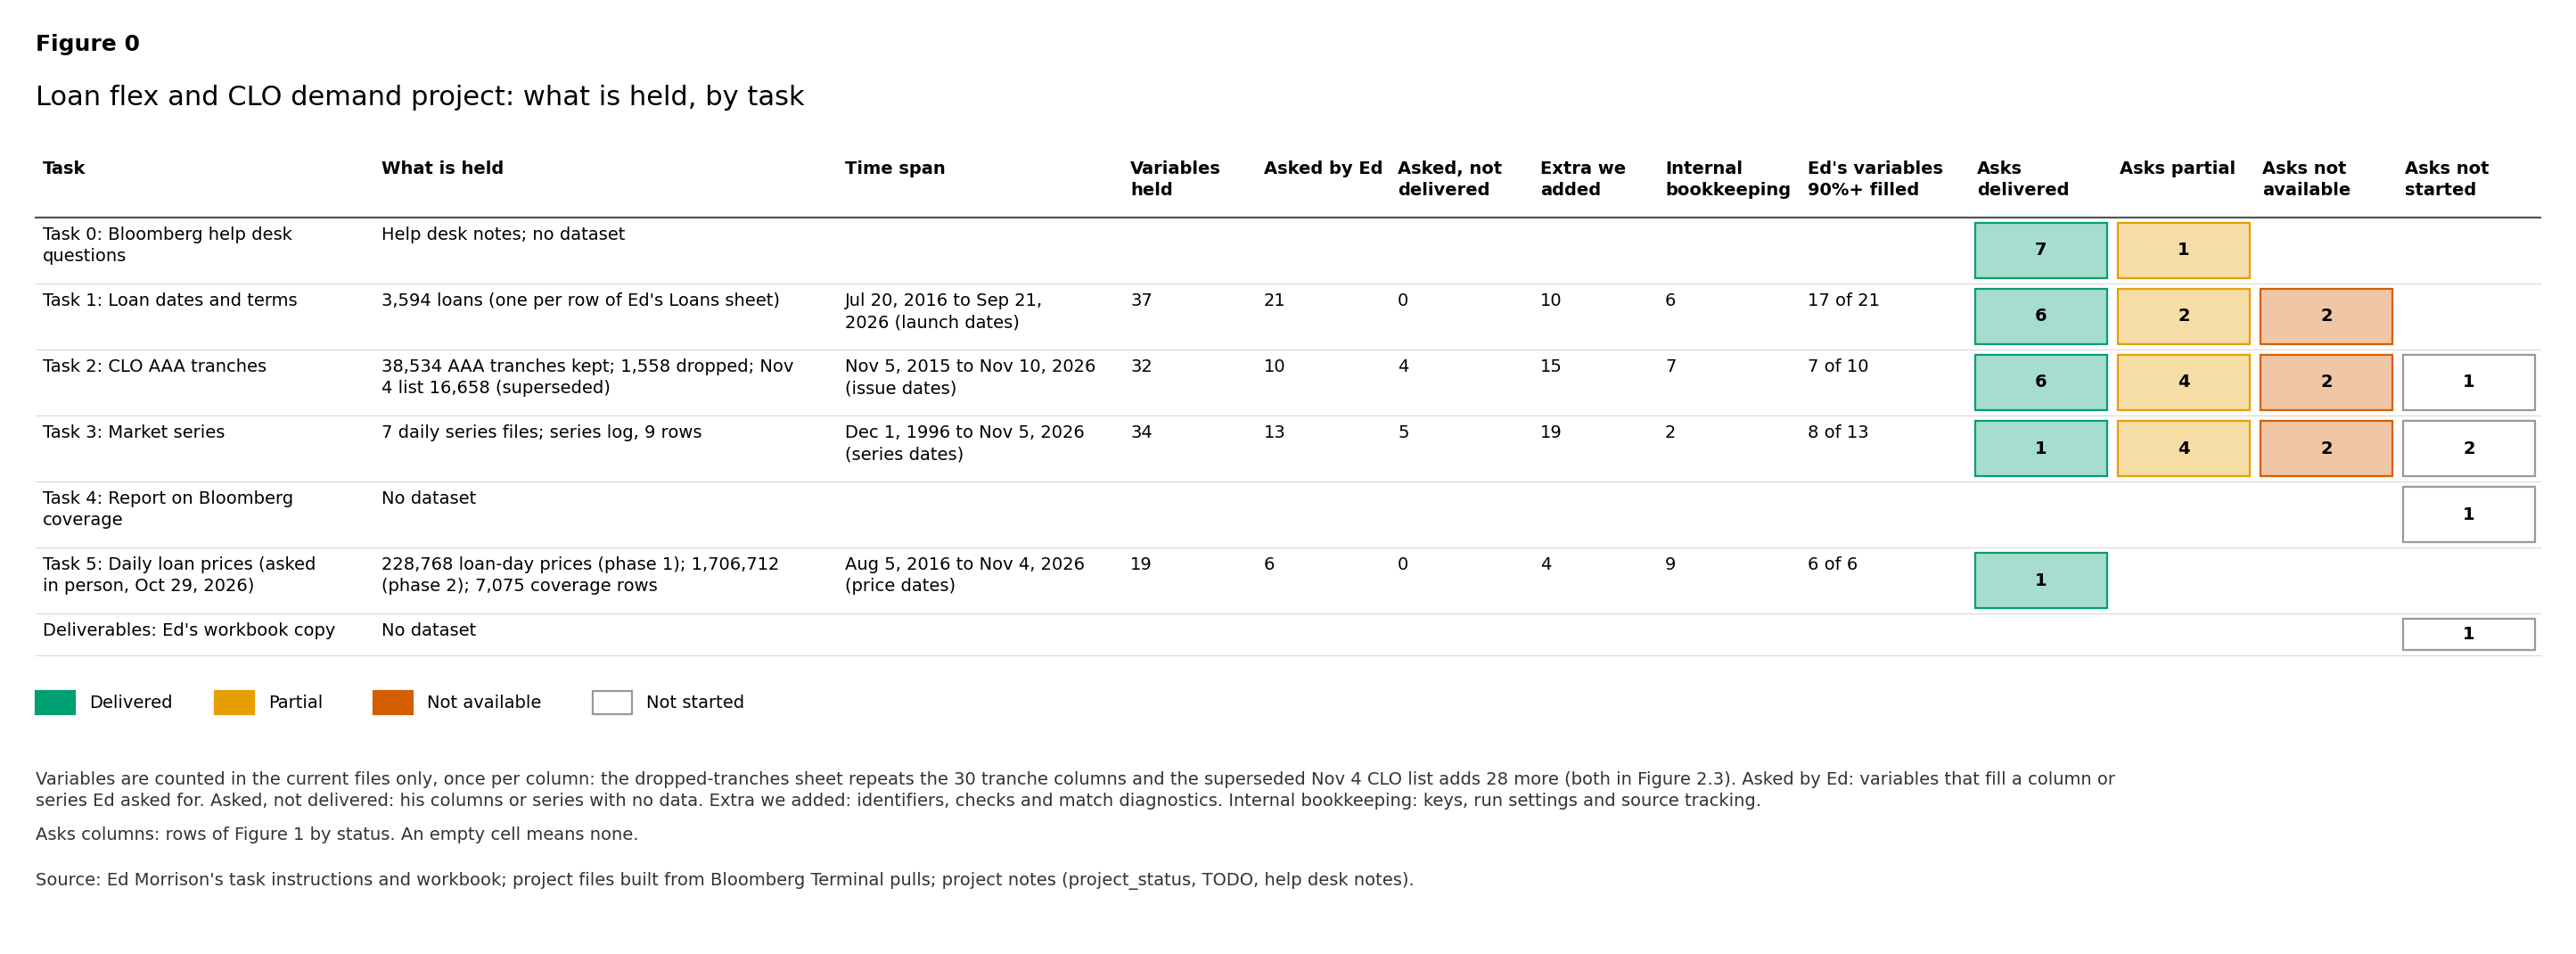
Every variable
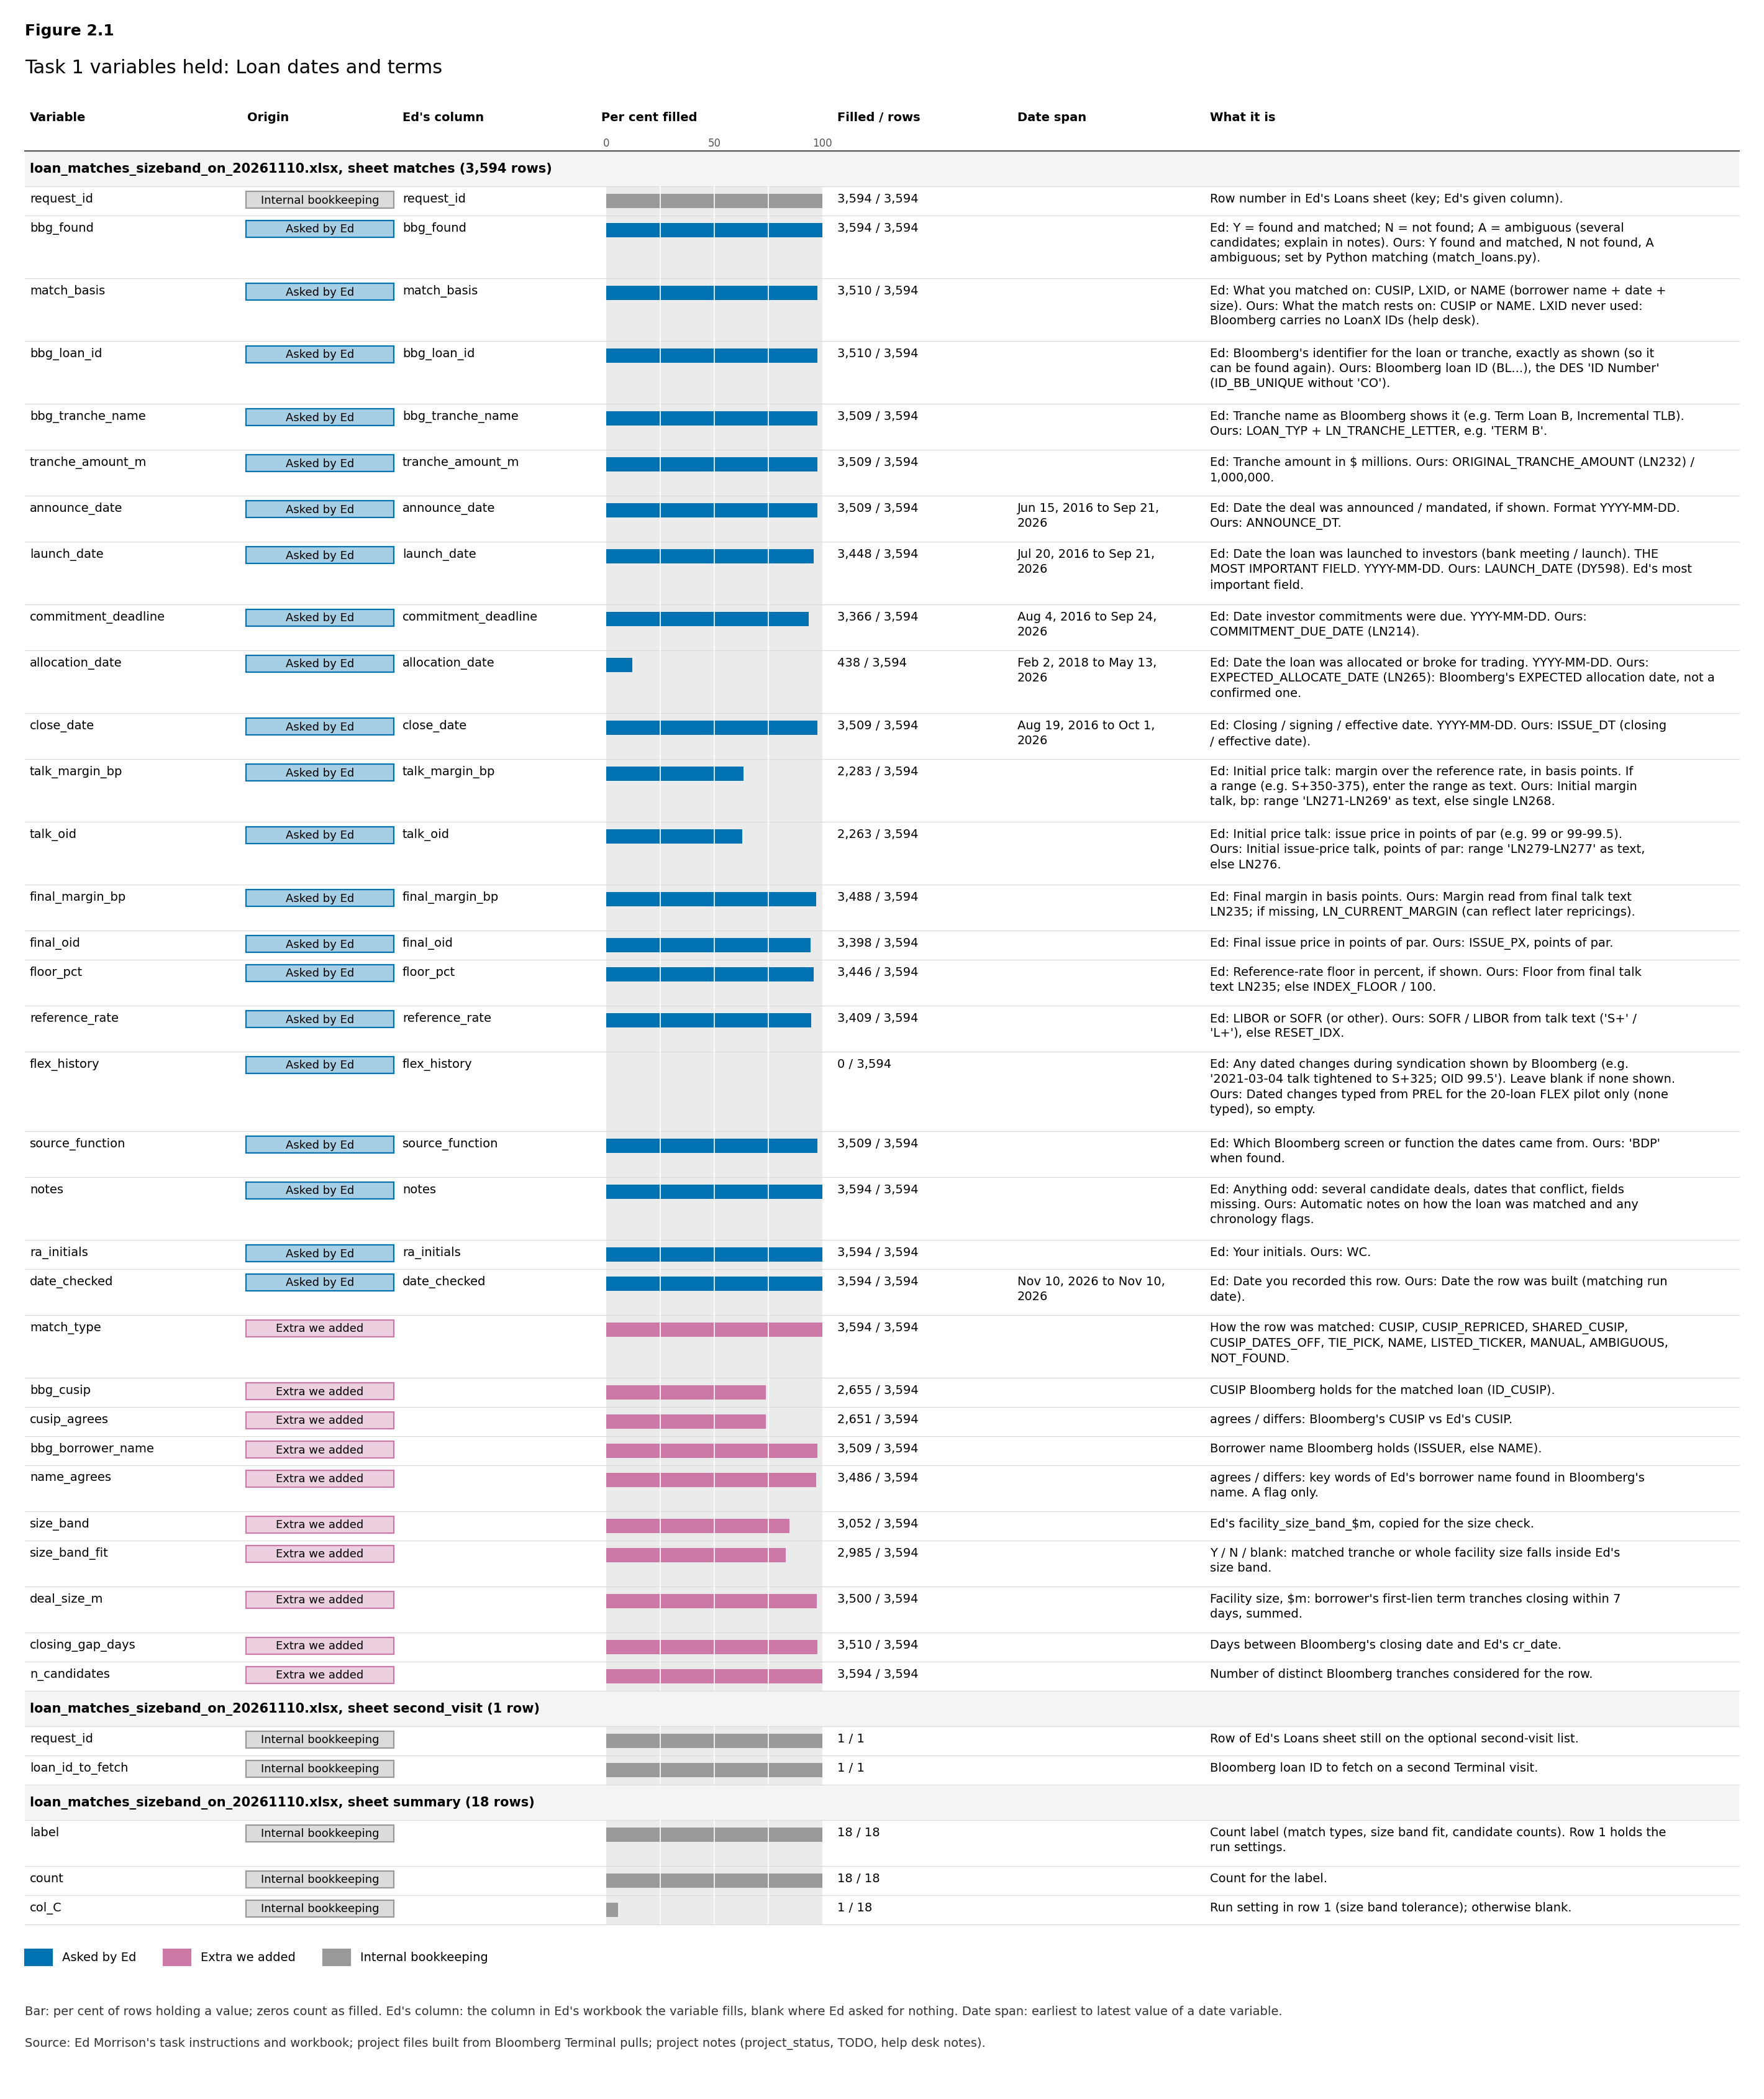
Task 1: loan dates
- Matched each of the 3,594 loans in the workbook to a Bloomberg tranche to get its announce, launch, allocation and close dates, talk and final margin, and issue price.
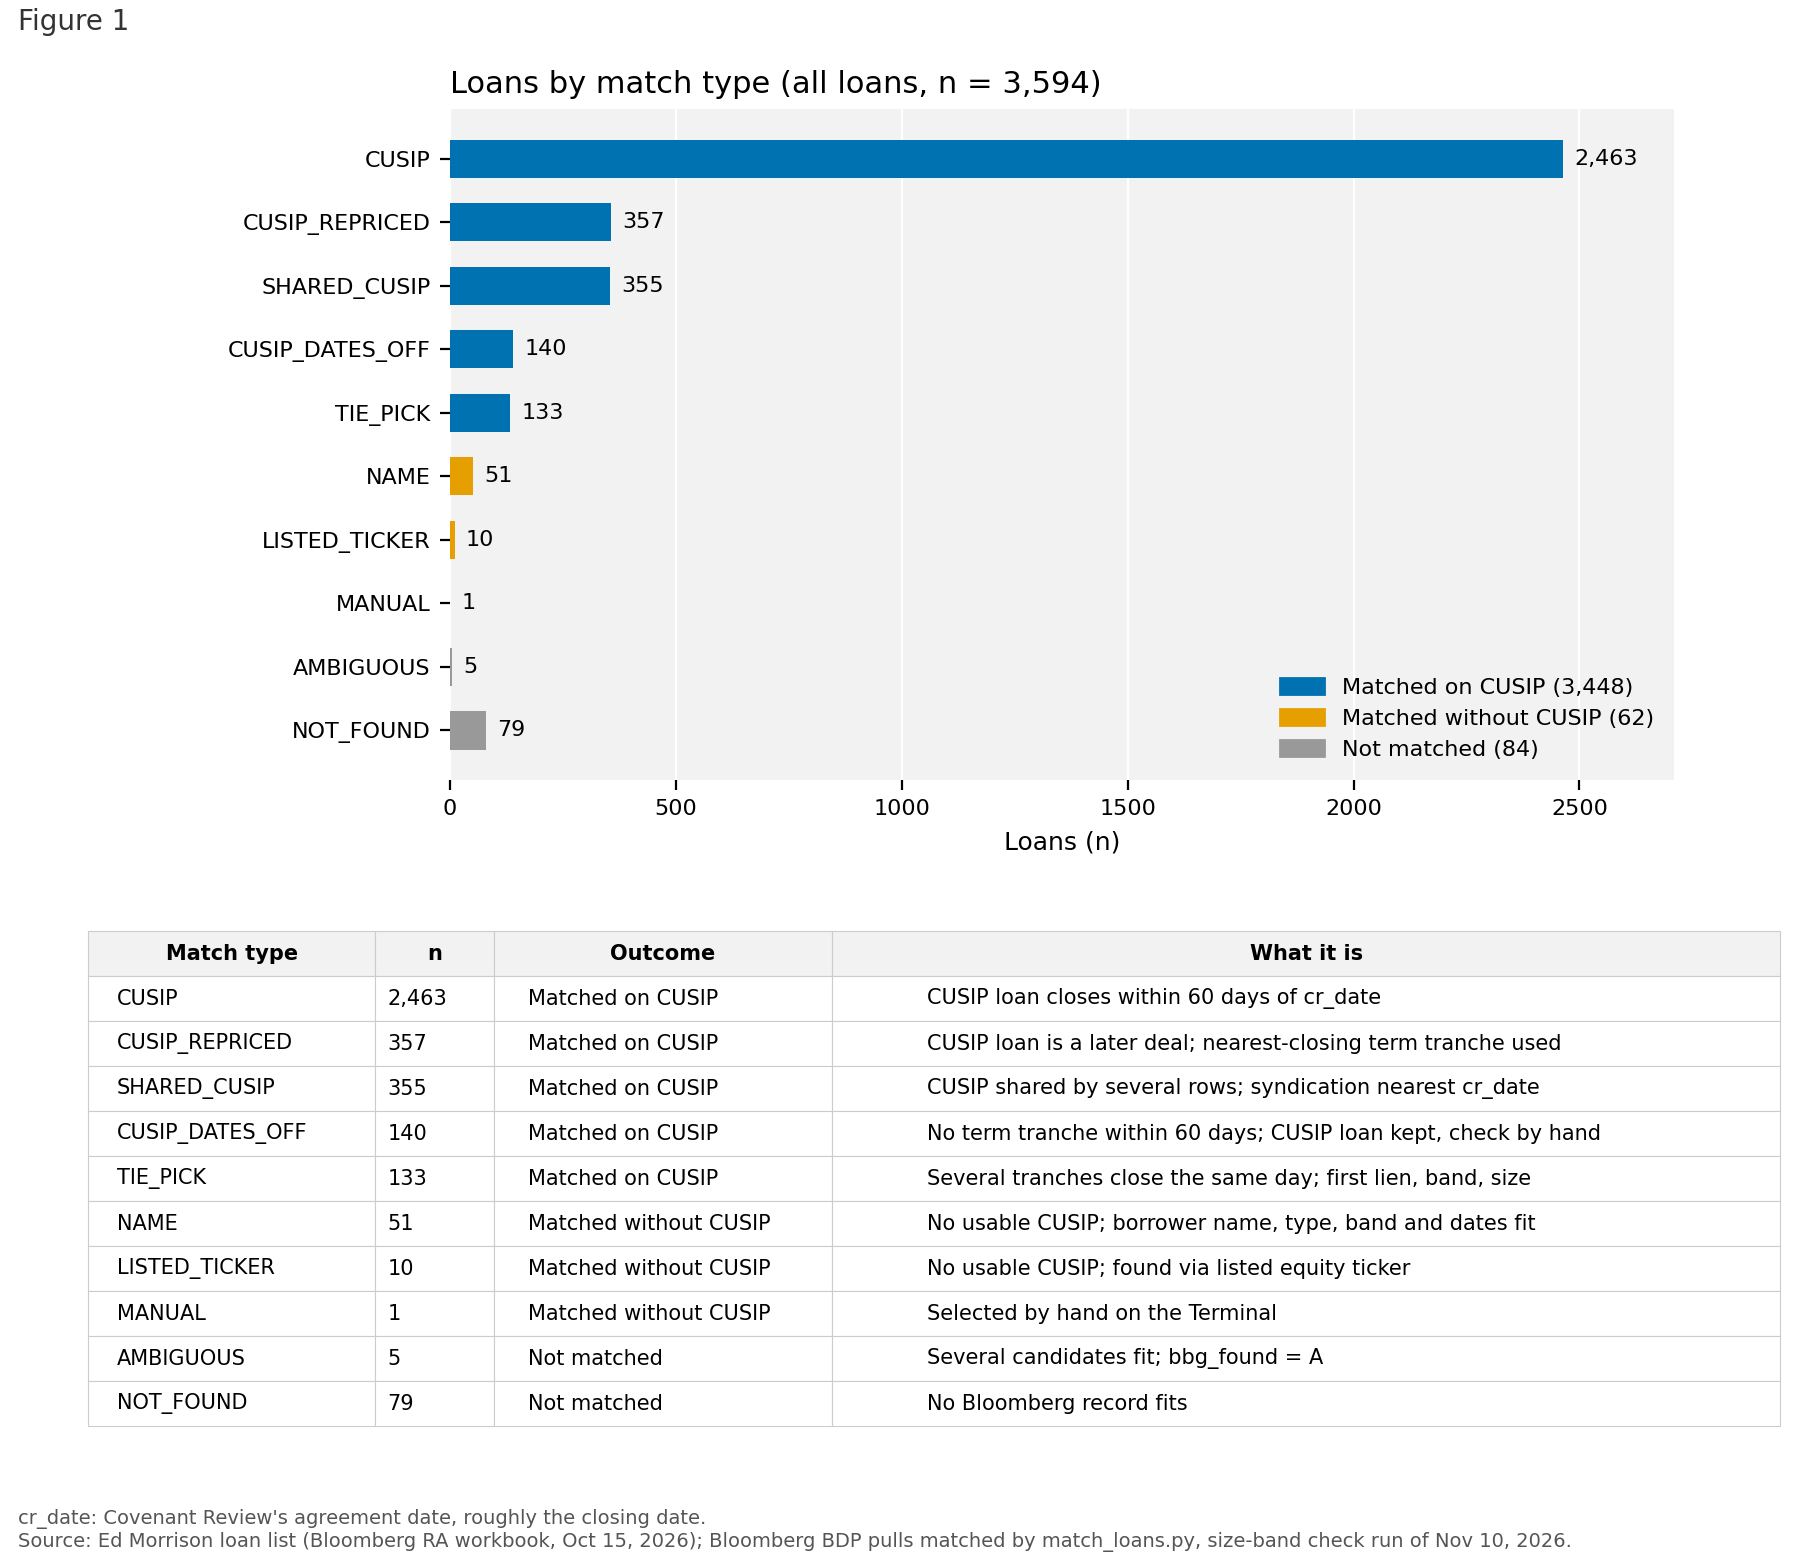
- Matched 3,510 loans (3,448 on CUSIP, 62 on name); 84 are not matched (79 not found, 5 ambiguous). See Task 1, figure 1.
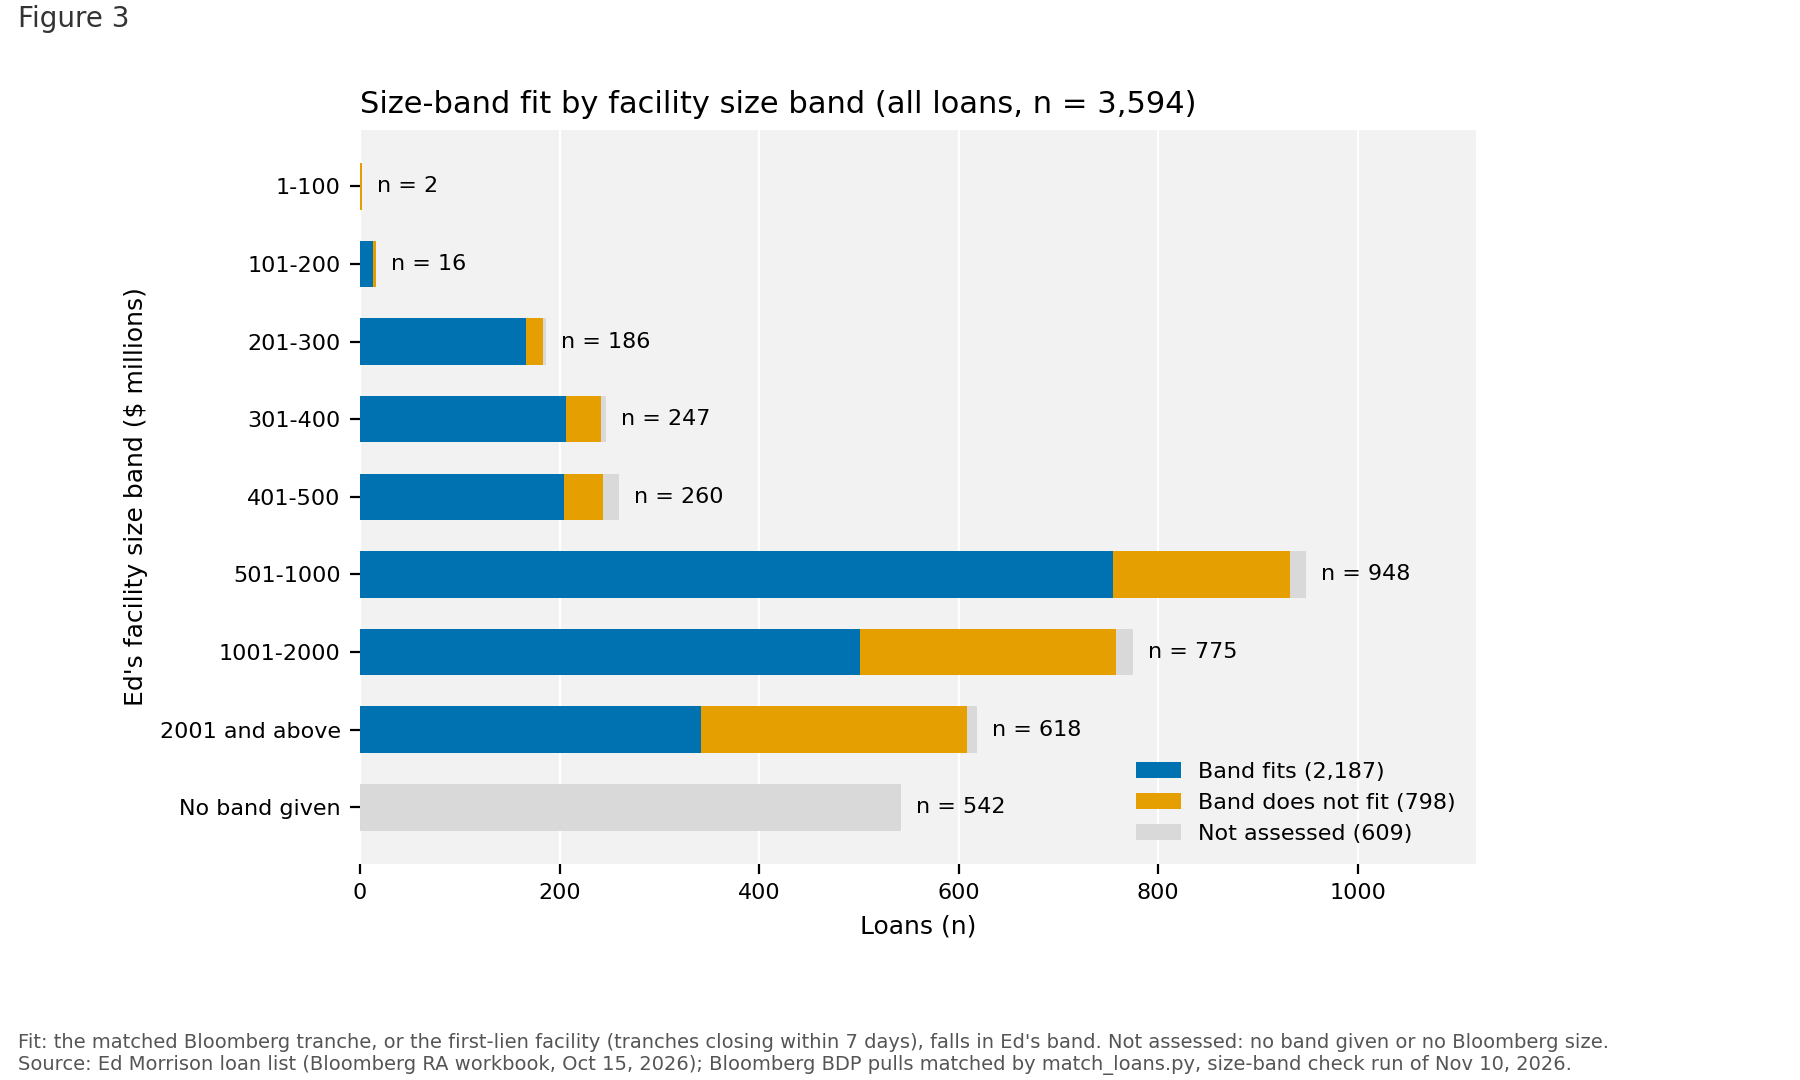
- Checked whether the matched tranche fits the facility size band on the loan list: it fits for 2,187 loans and does not fit for 798 (see Task 1, figure 3).
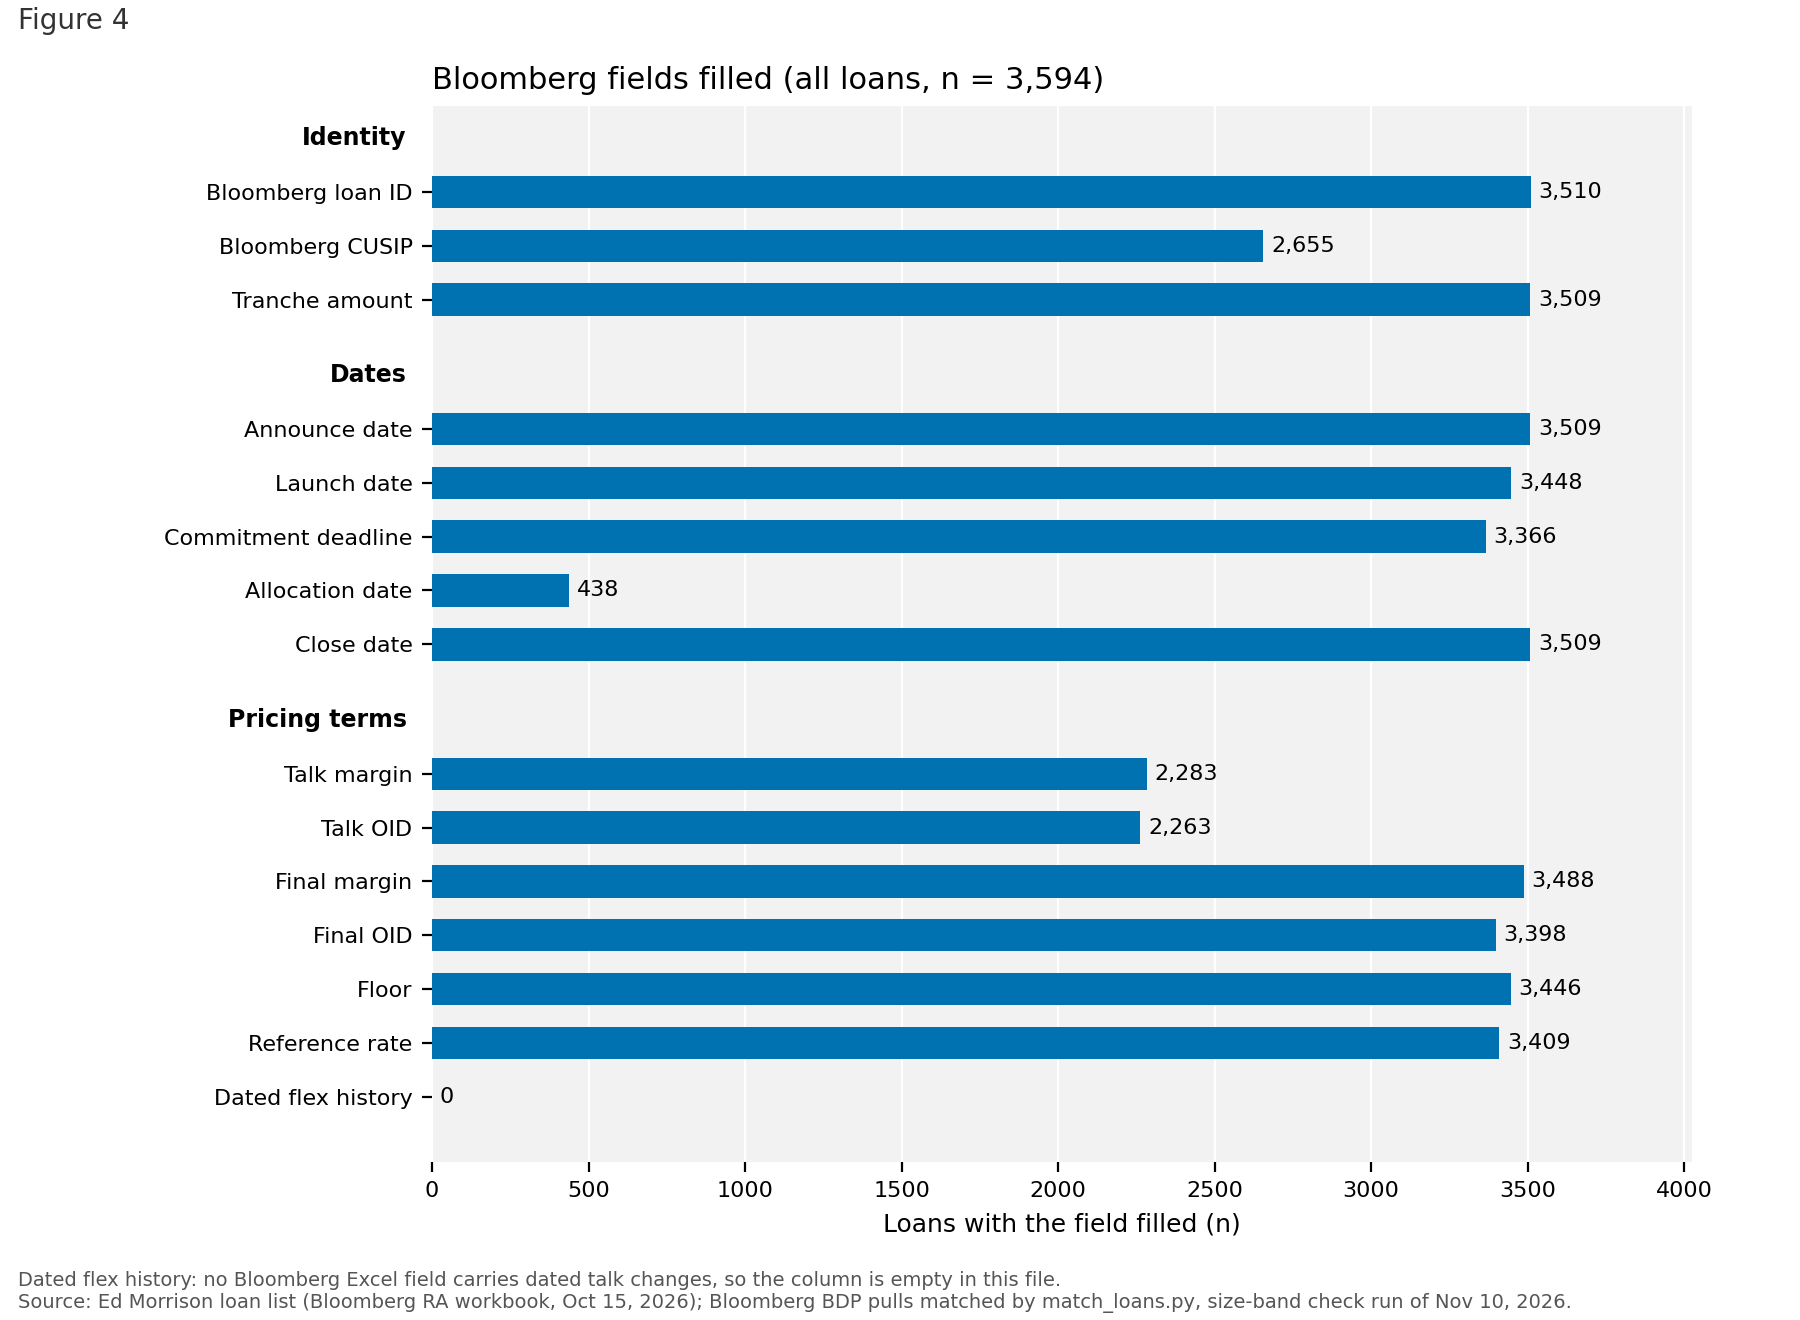
- Checked how many loans have each field filled. Dated flex history is empty for all 3,594 loans, and the allocation date is filled for 438 (see Task 1, figure 4).
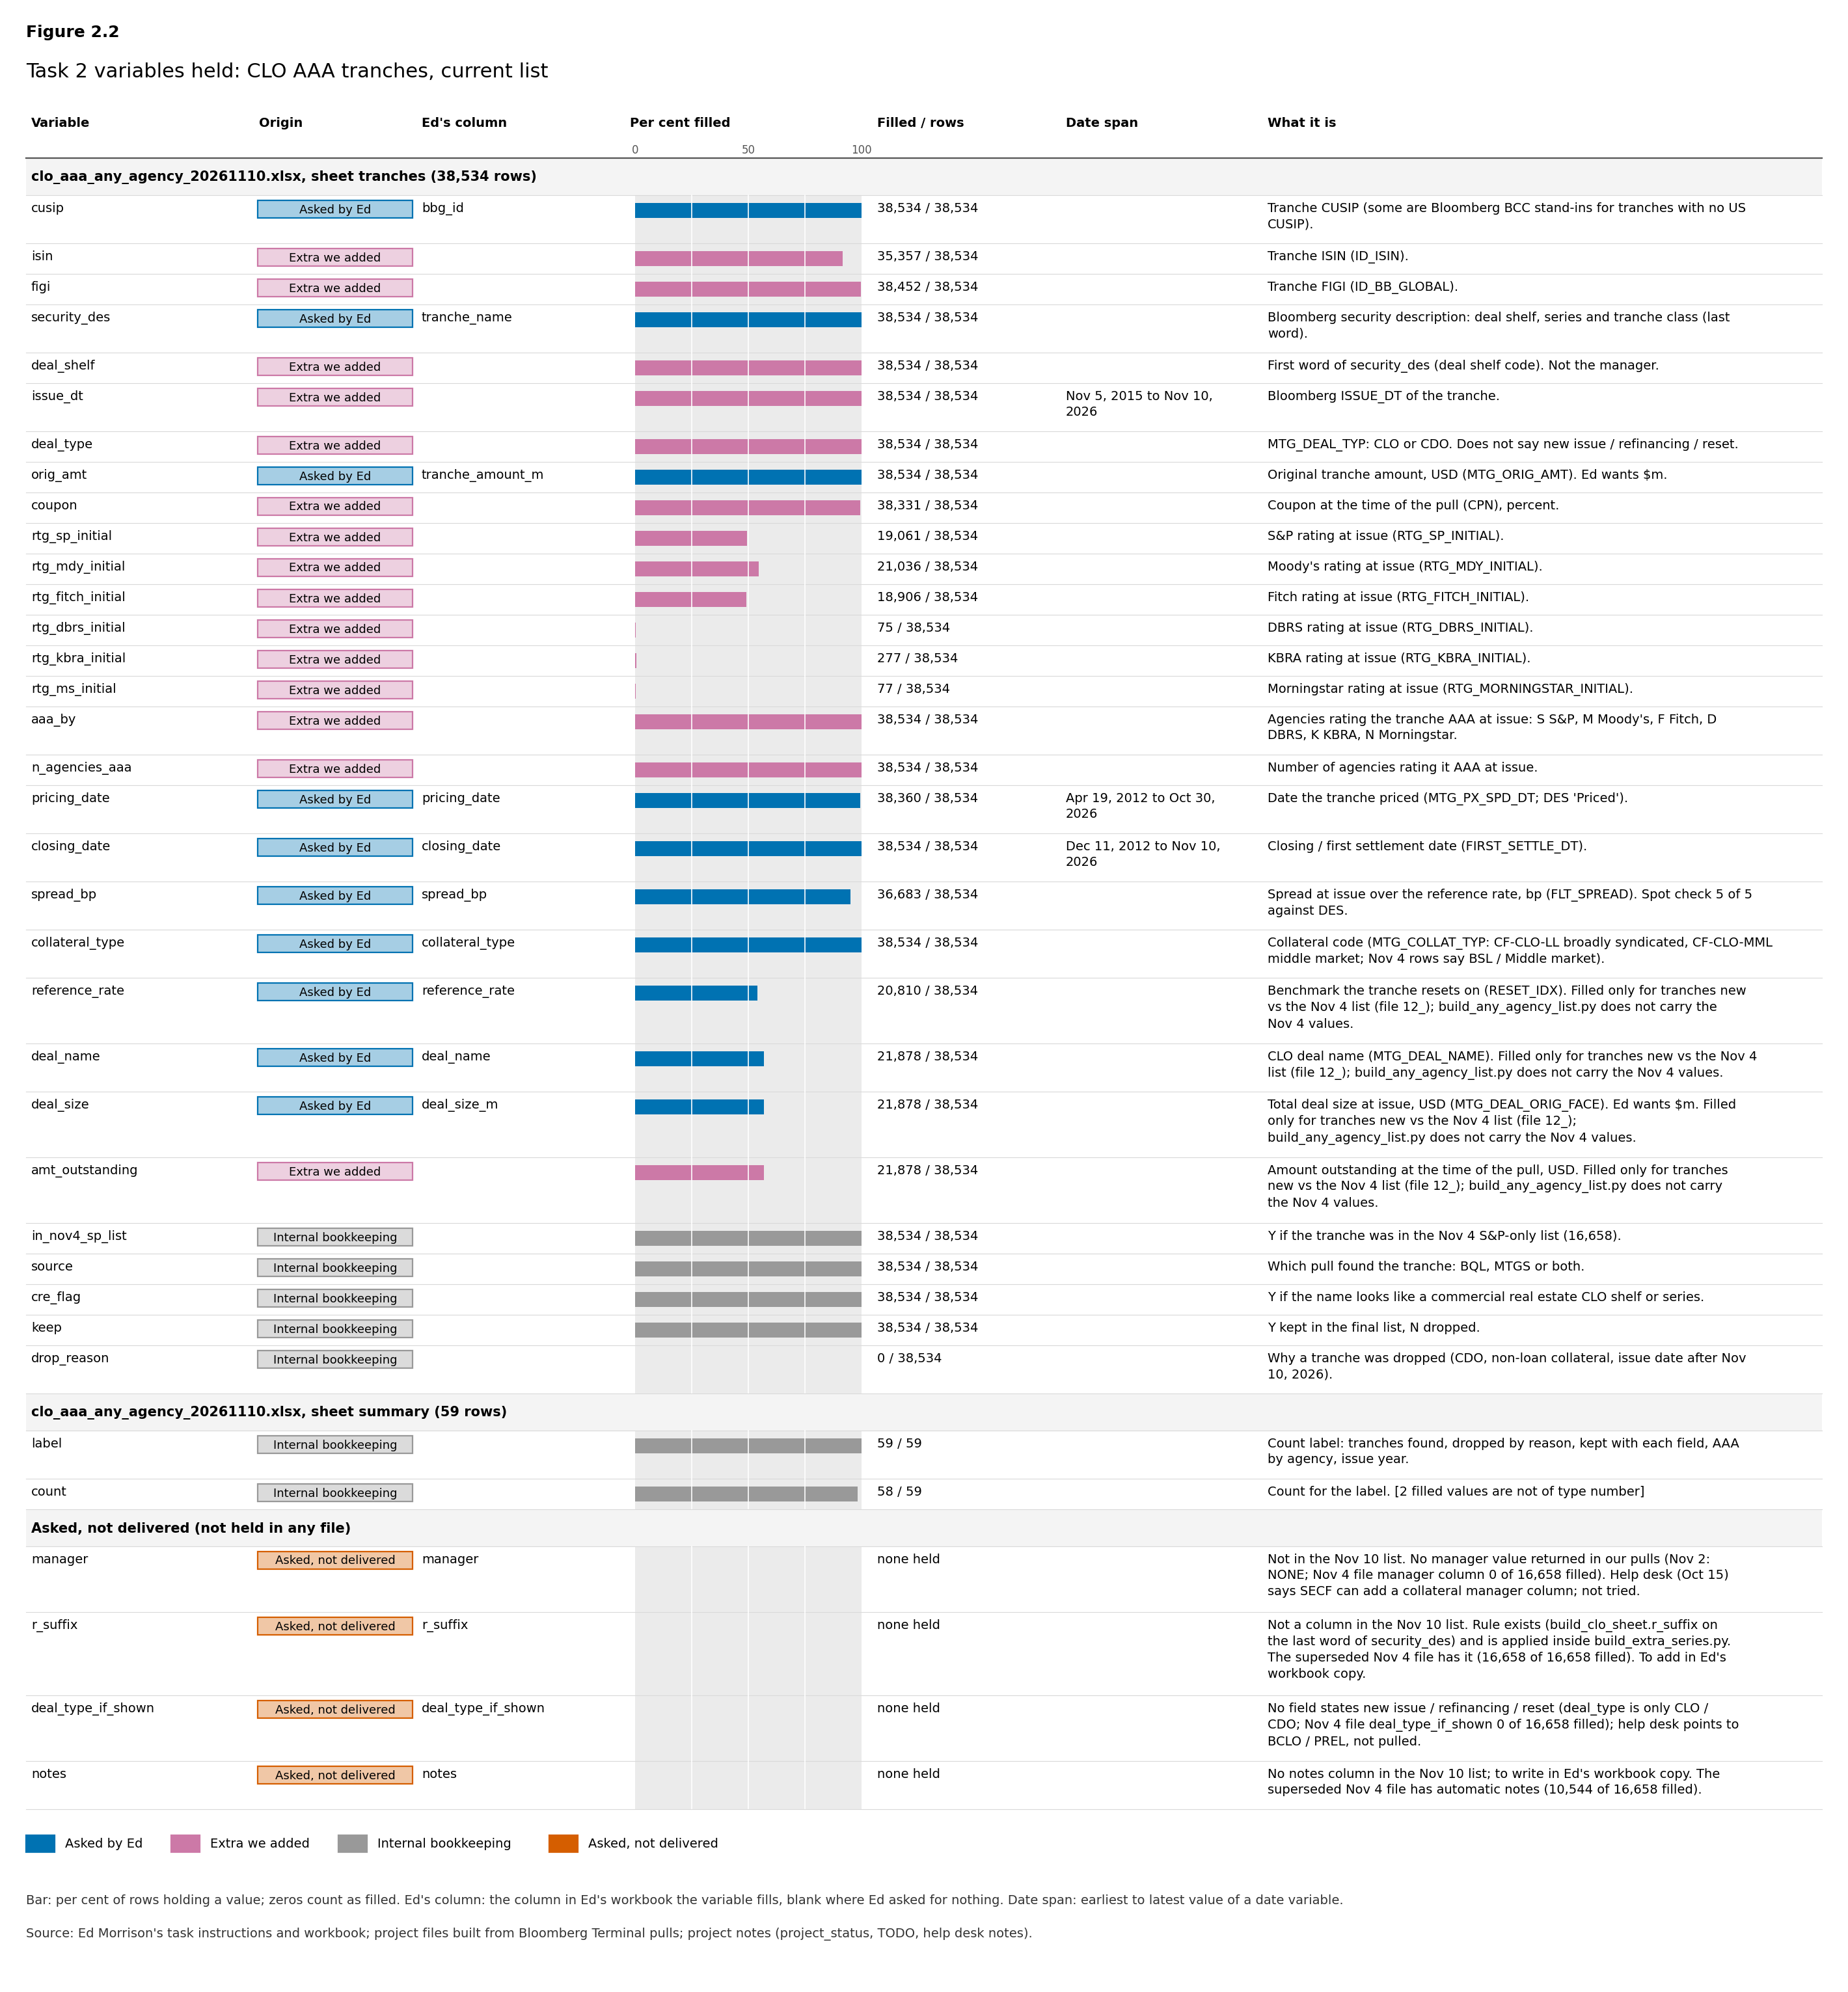
Task 2: CLO AAA tranches
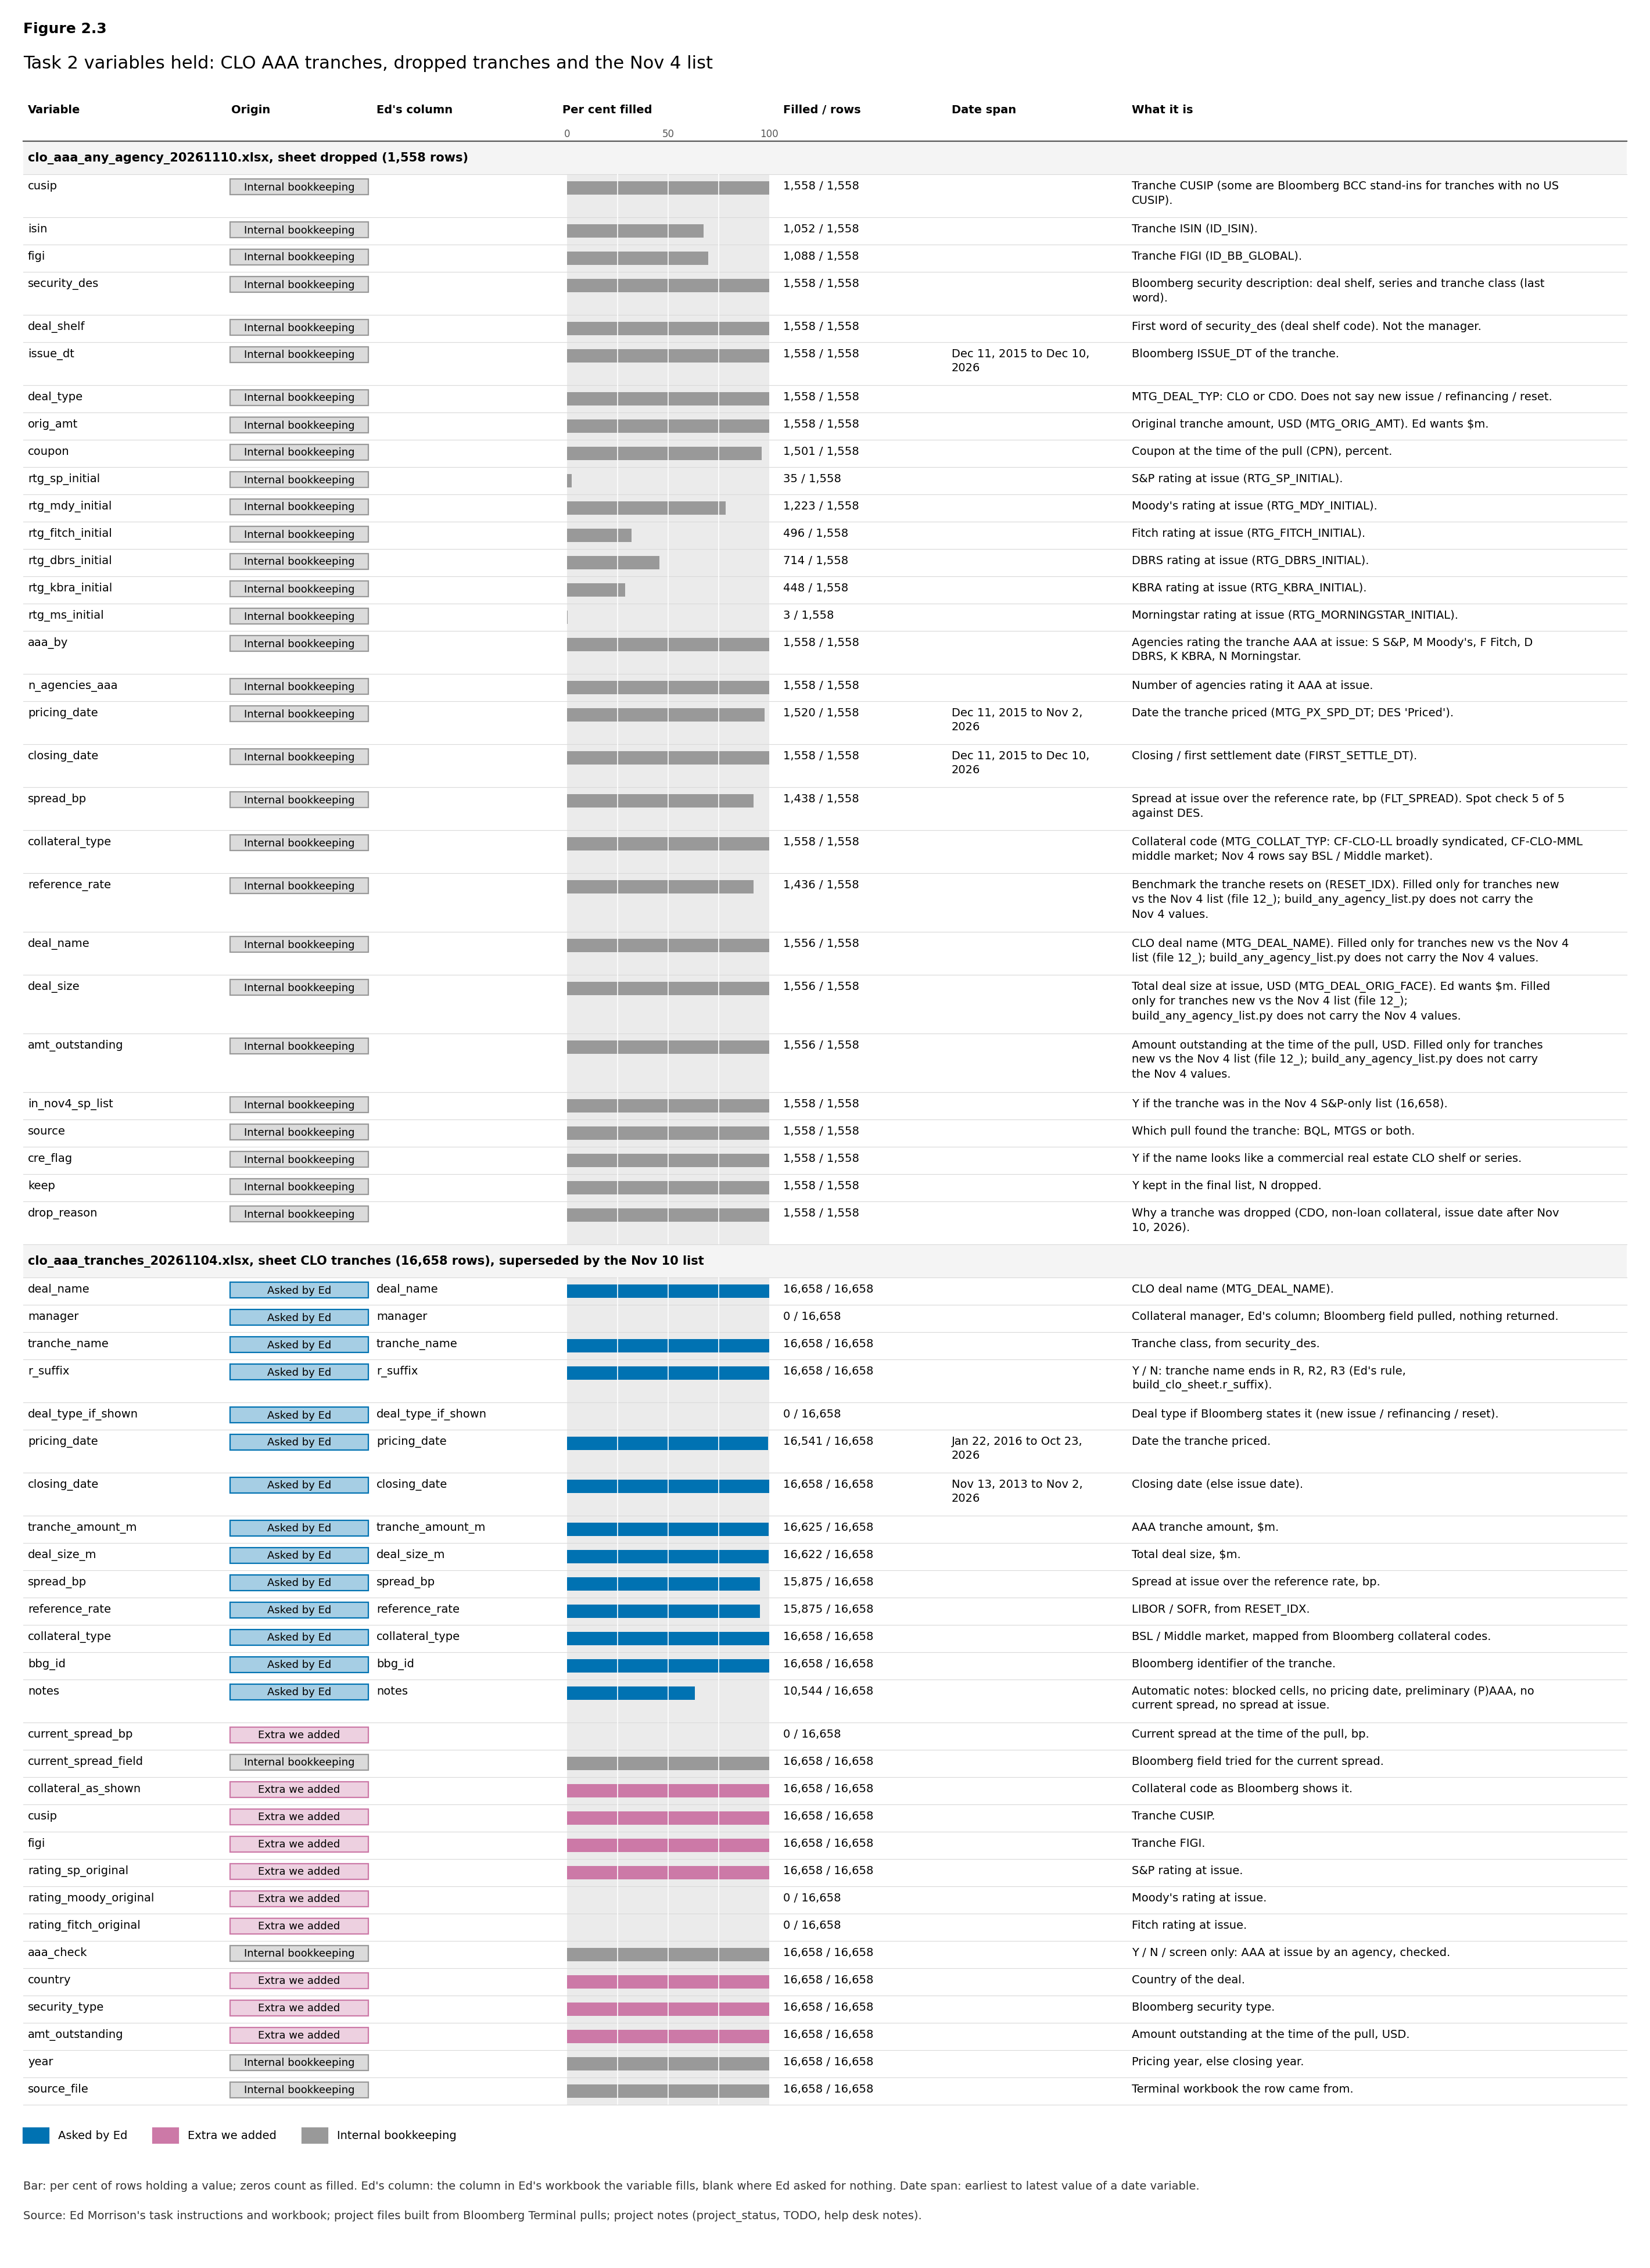
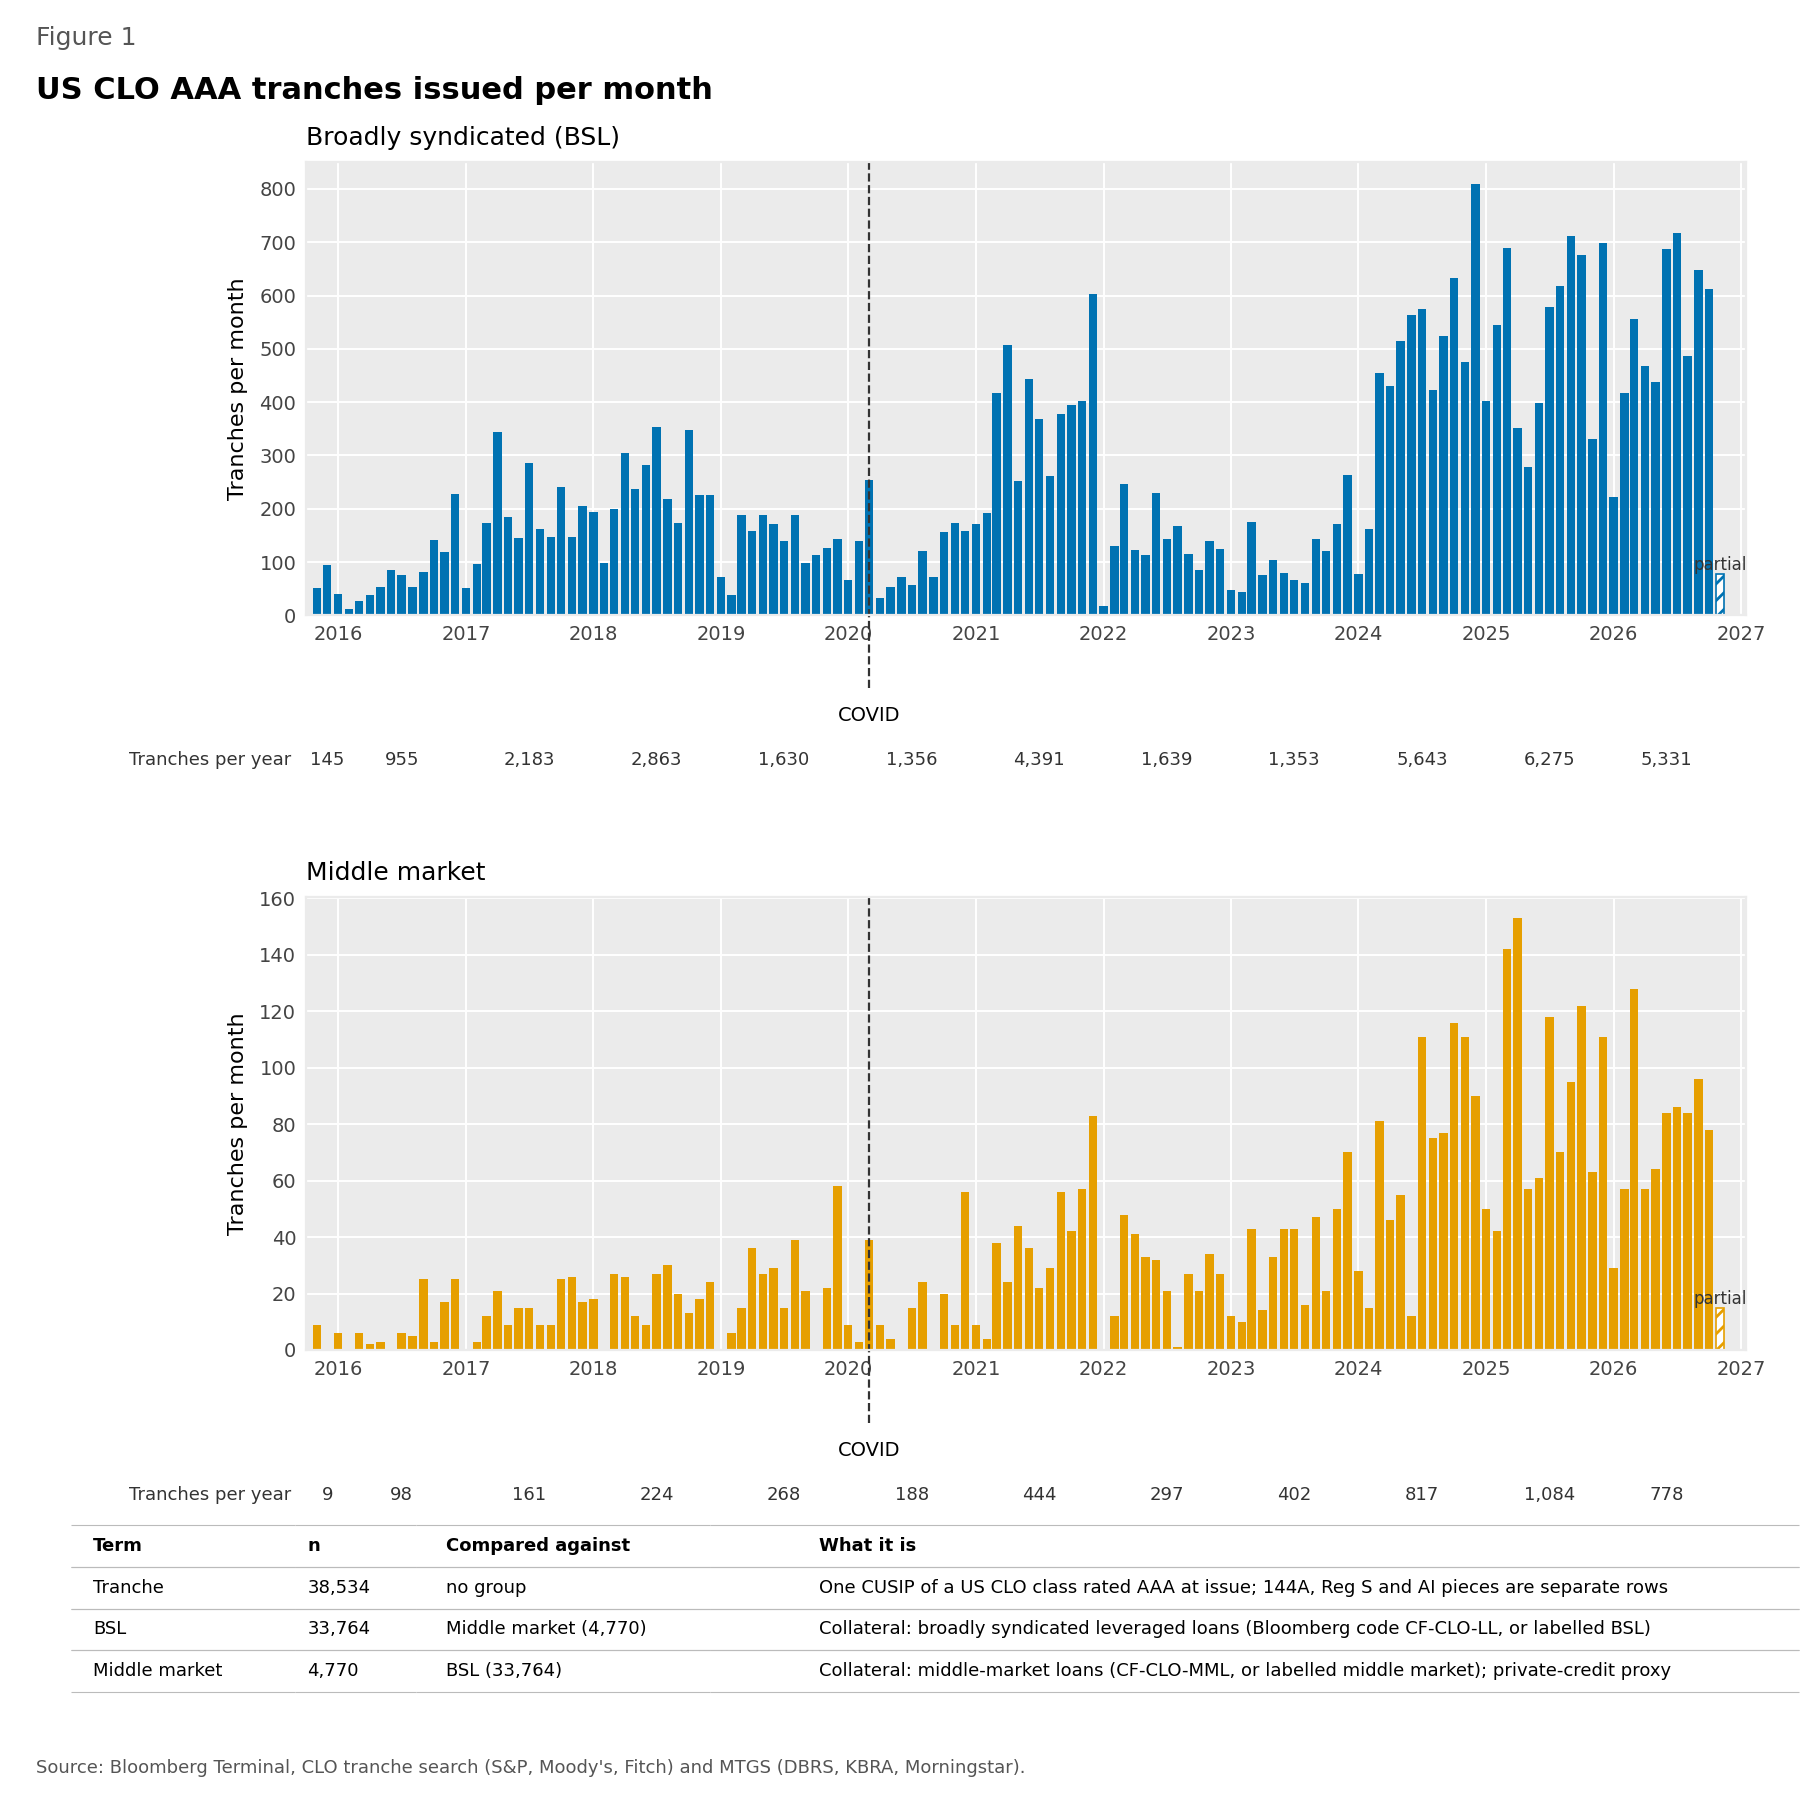
- Collected every US leveraged-loan CLO tranche rated AAA at issue by any of six agencies (S&P, Moody's, Fitch, DBRS, KBRA, Morningstar), issued Nov 2015 to Nov 10, 2026: 38,534 CUSIPs, 33,764 broadly syndicated loan (BSL) and 4,770 middle market. See Task 2, figure 1.
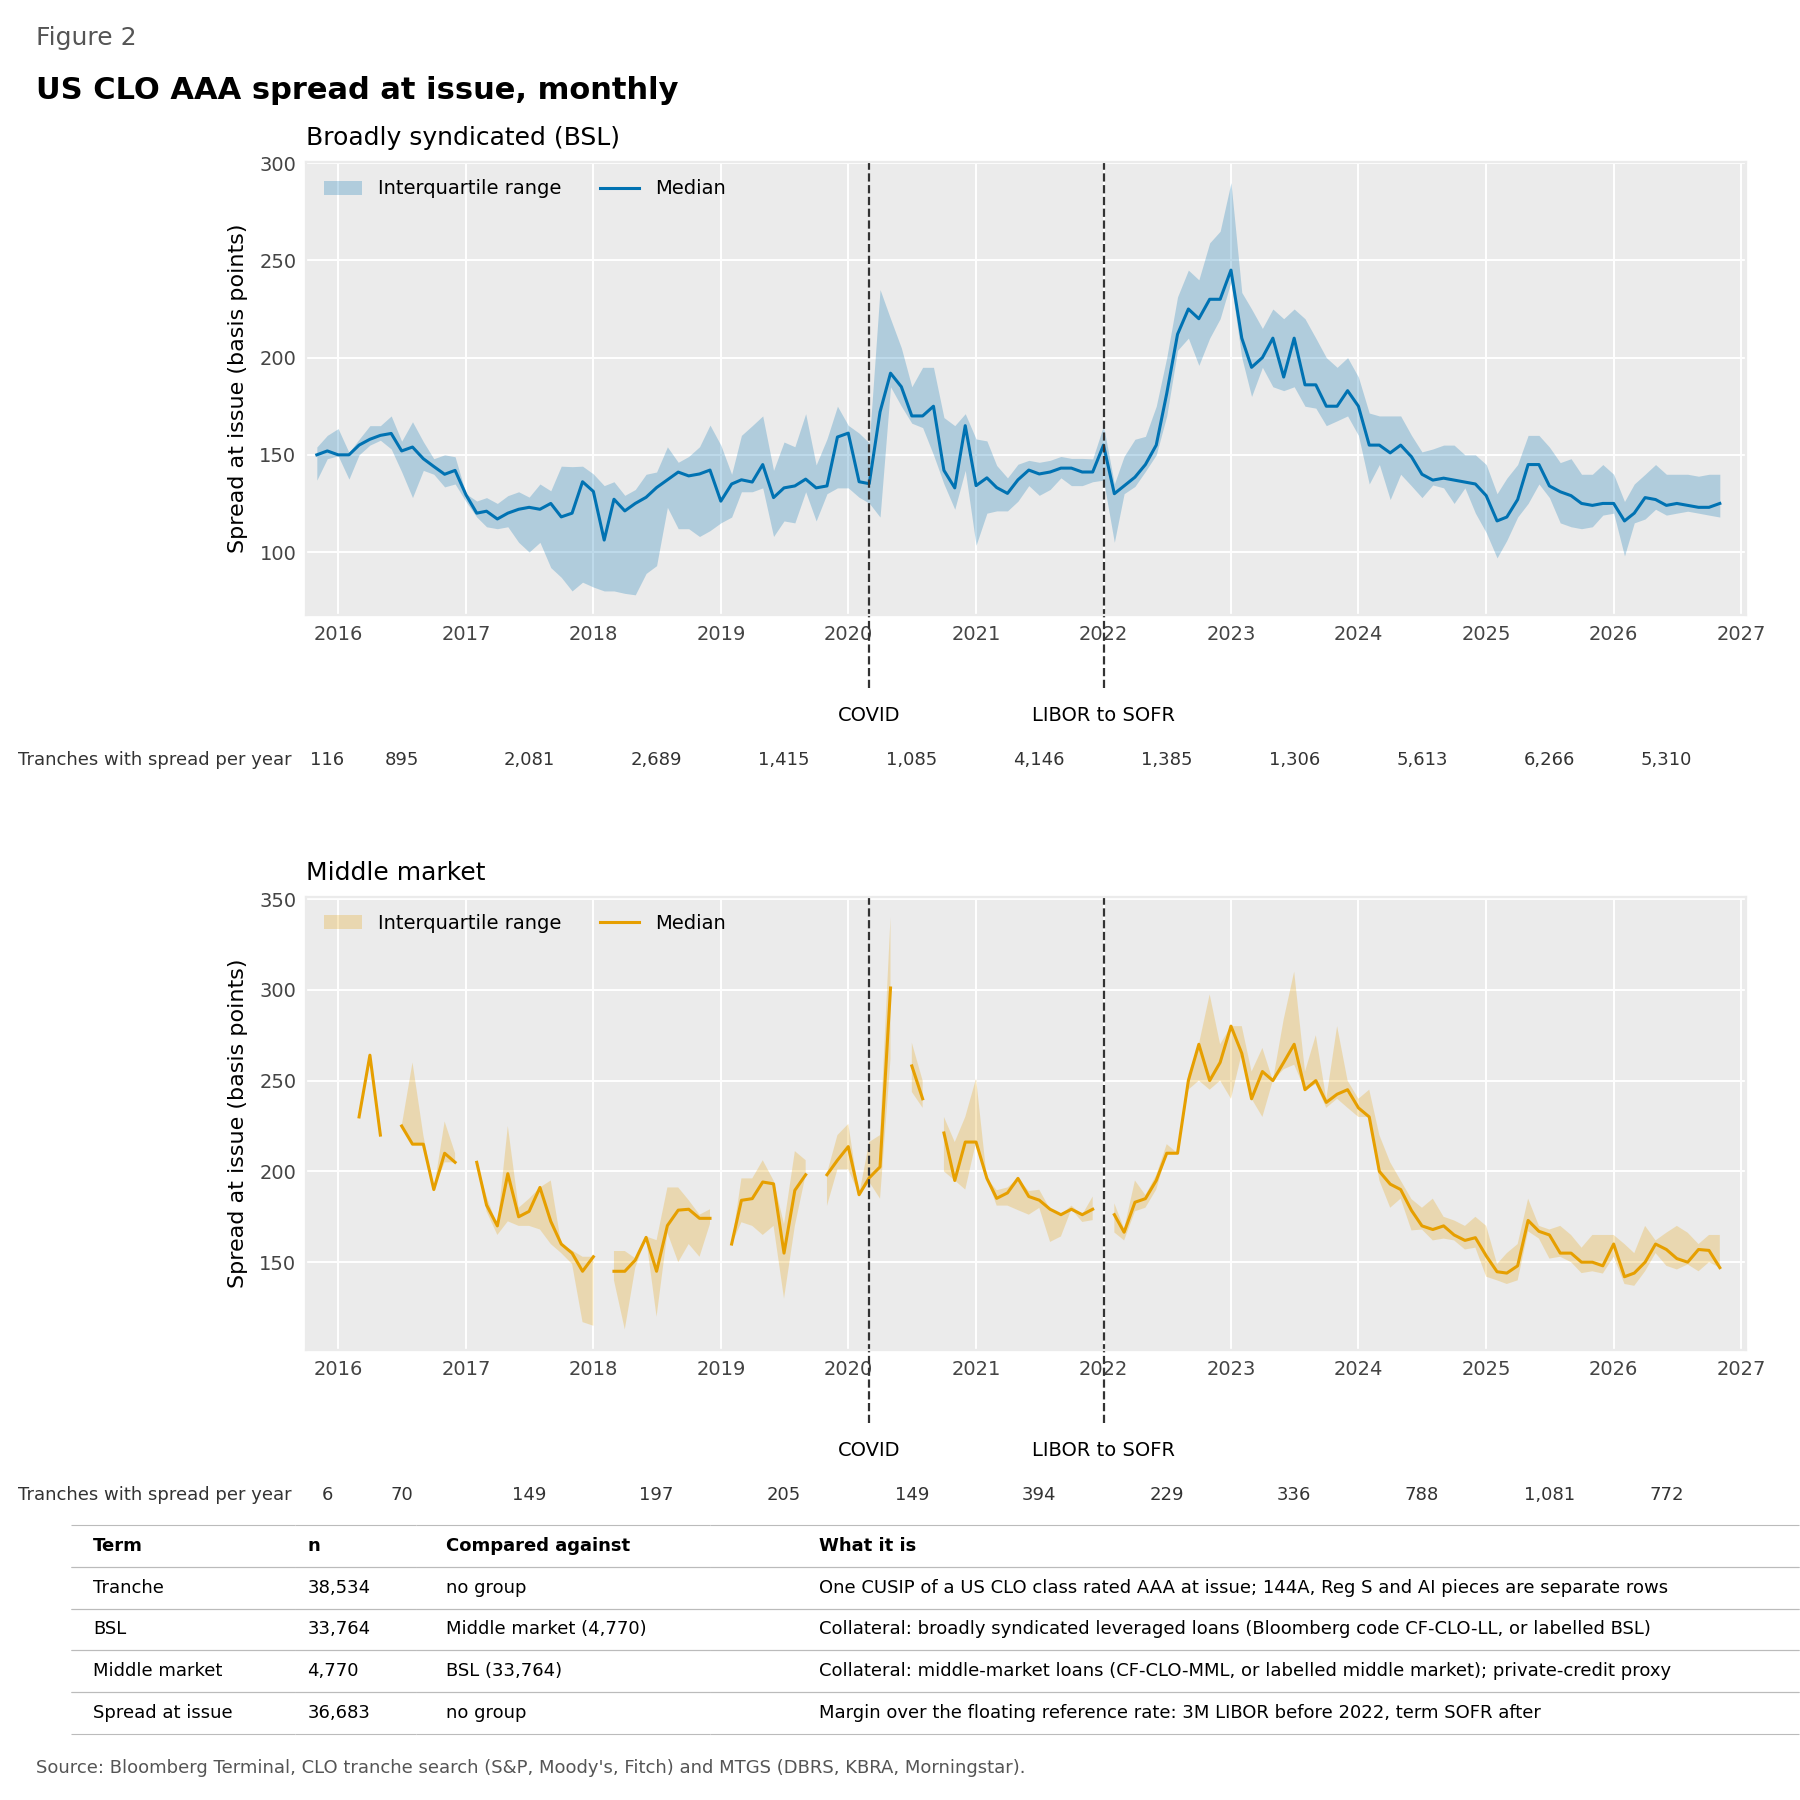
- Pulled the spread at issue for 36,683 of them and plotted the monthly median by market (see Task 2, figure 2).
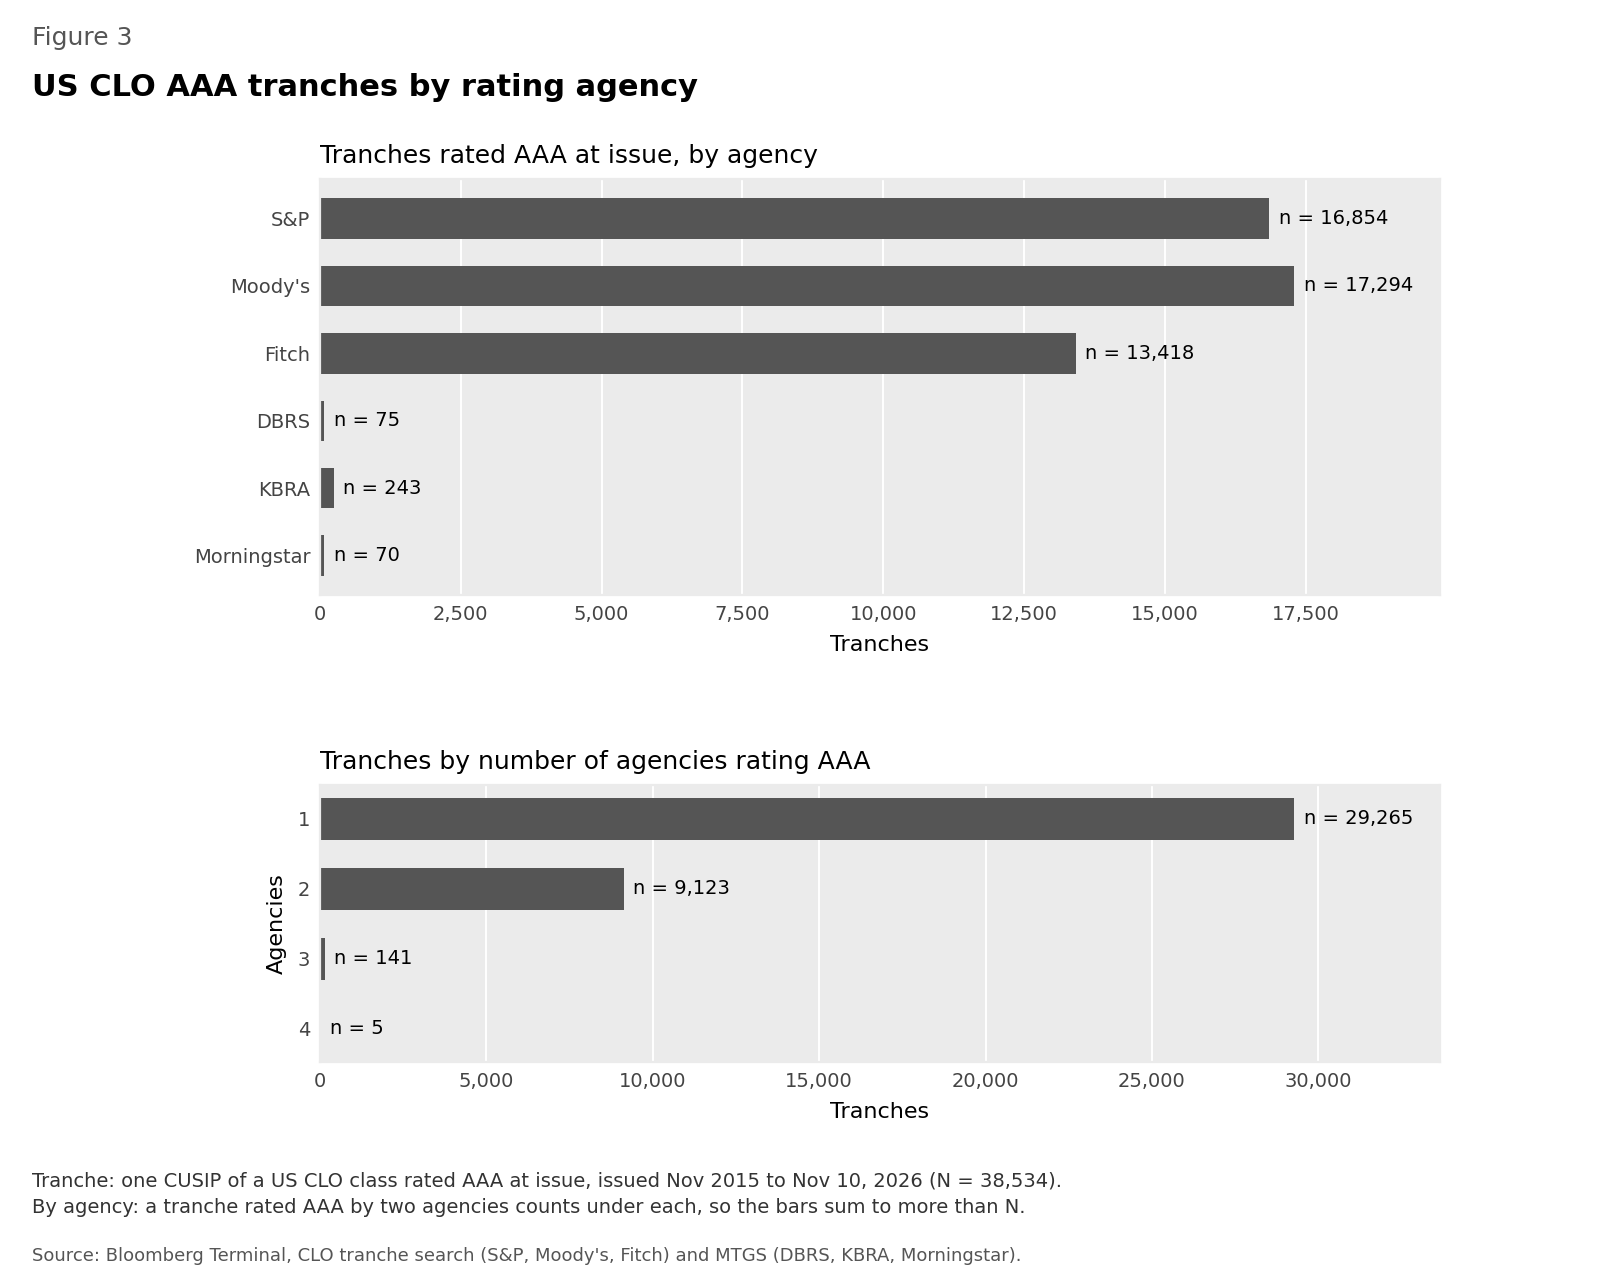
- Counted how many agencies rated each tranche AAA: one agency for 29,265, two for 9,123, three for 141, four for 5 (see Task 2, figure 3).
Task 3: daily market series
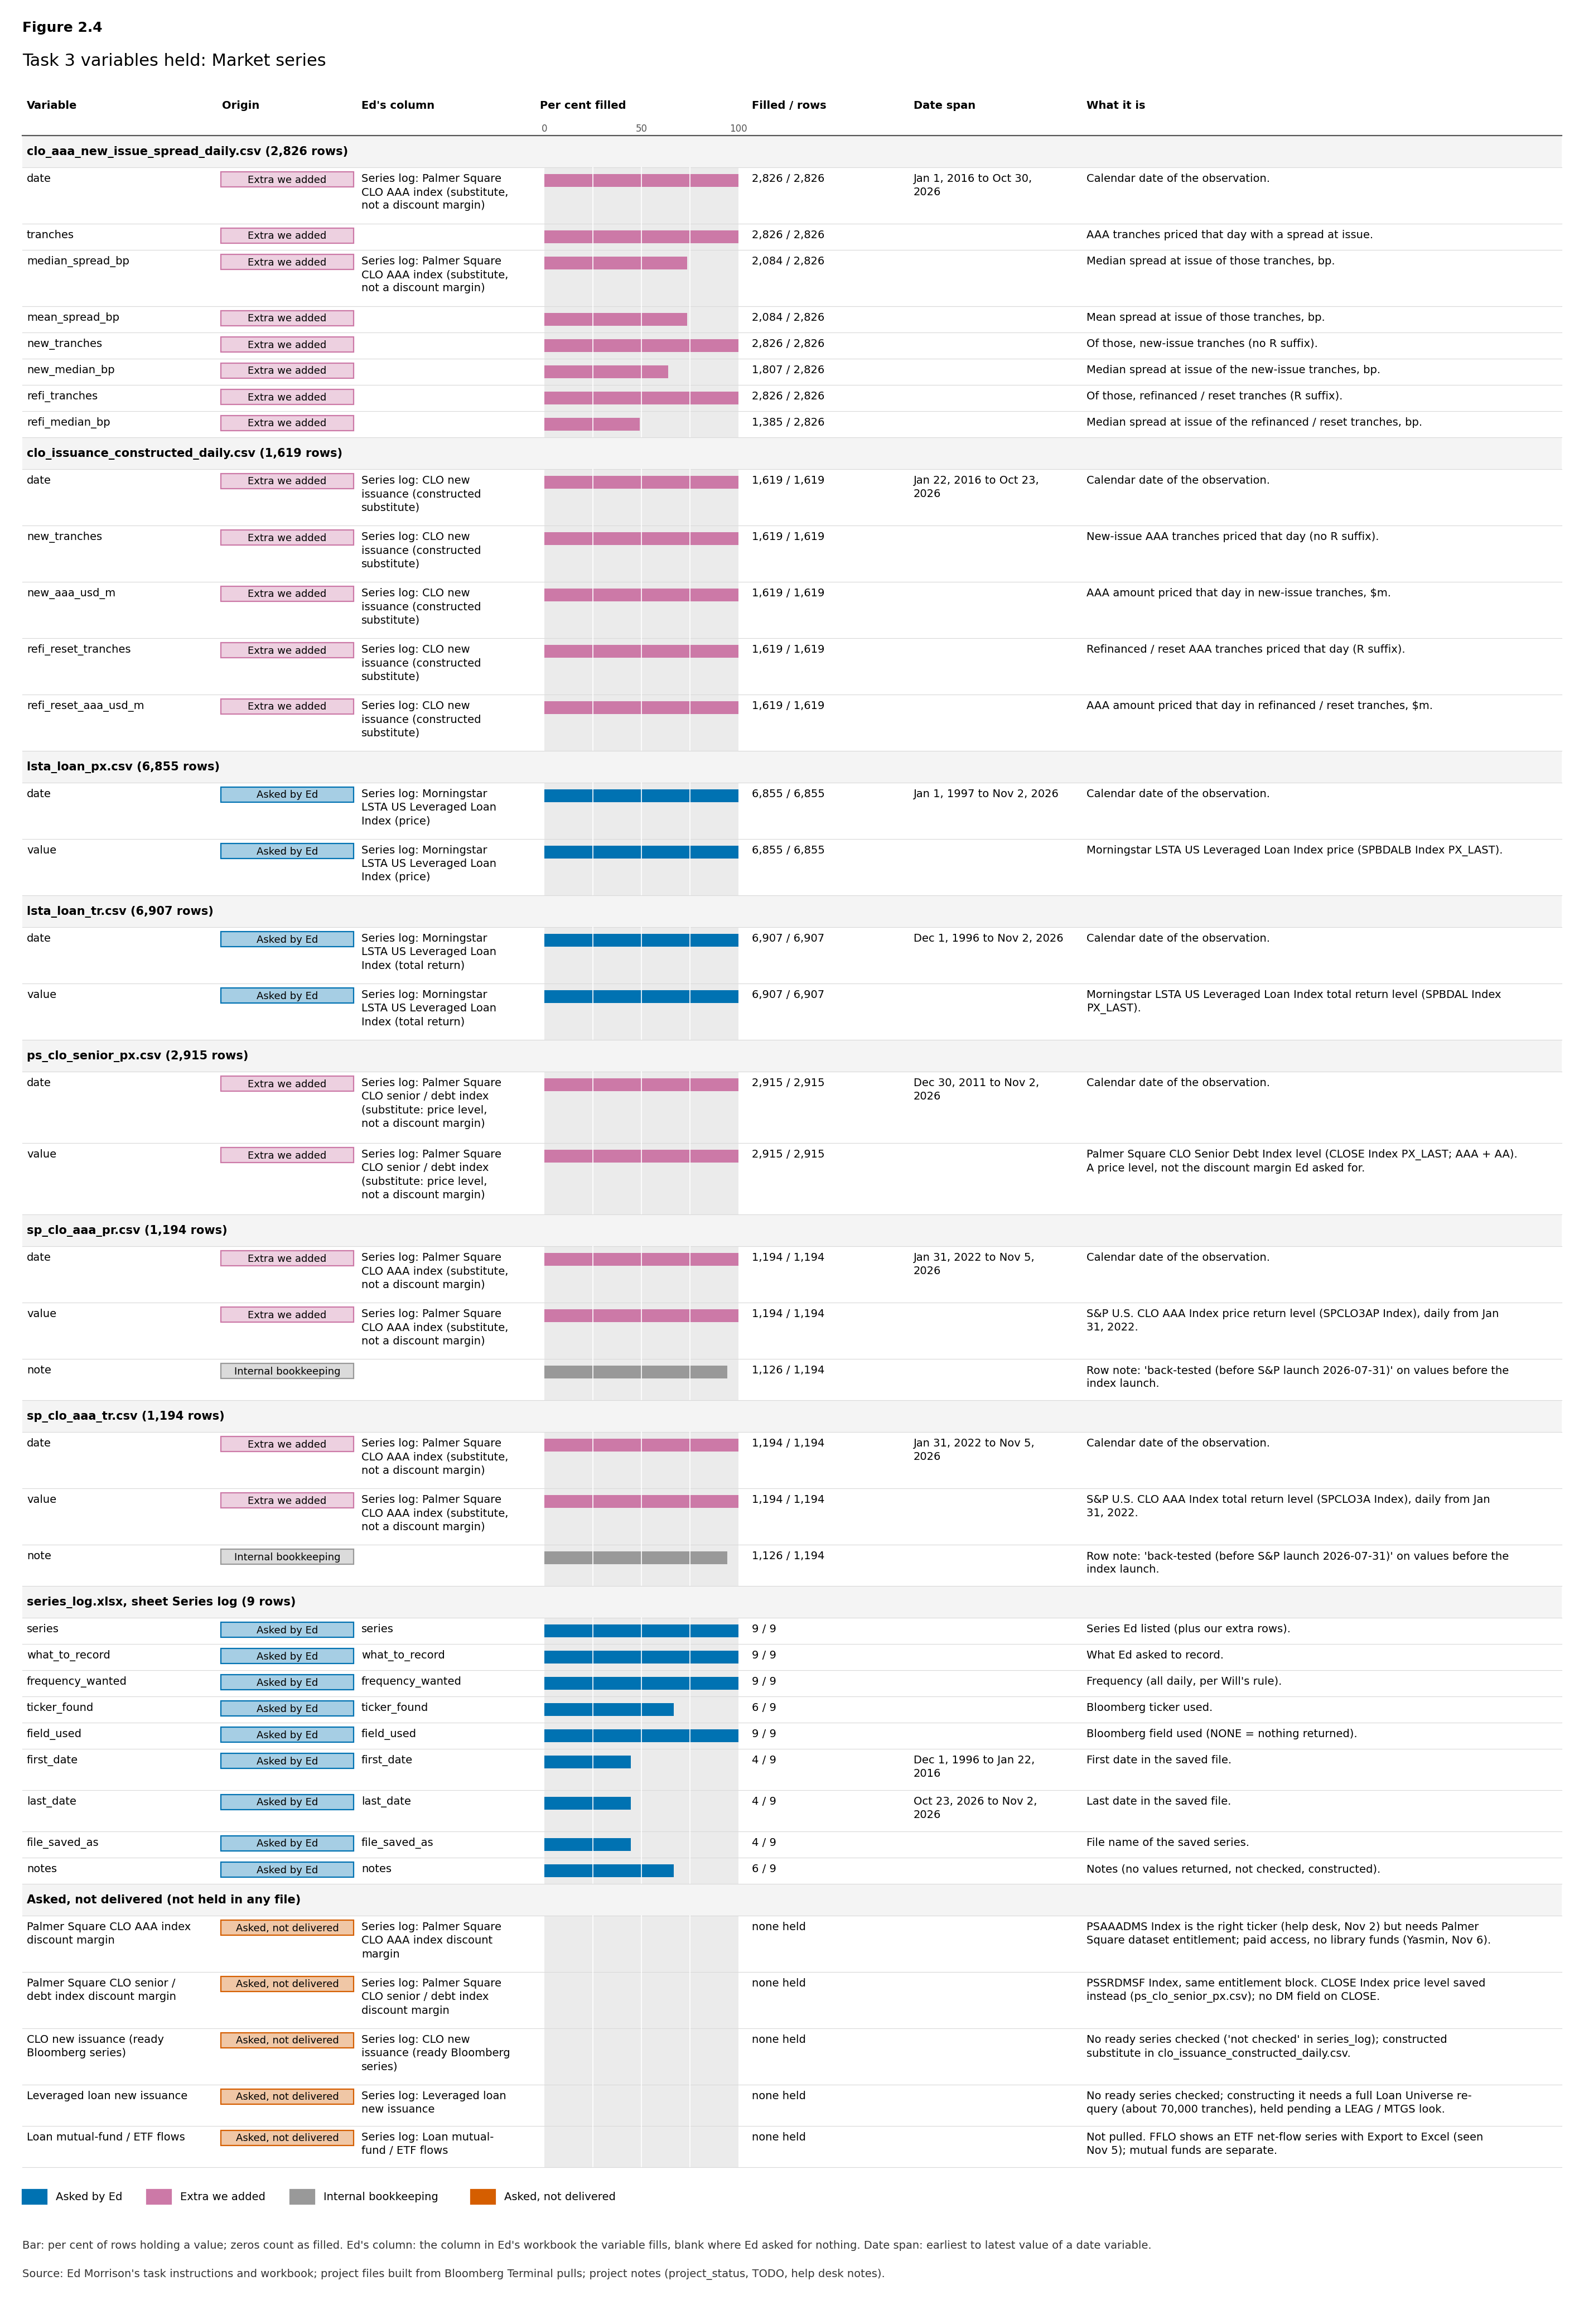
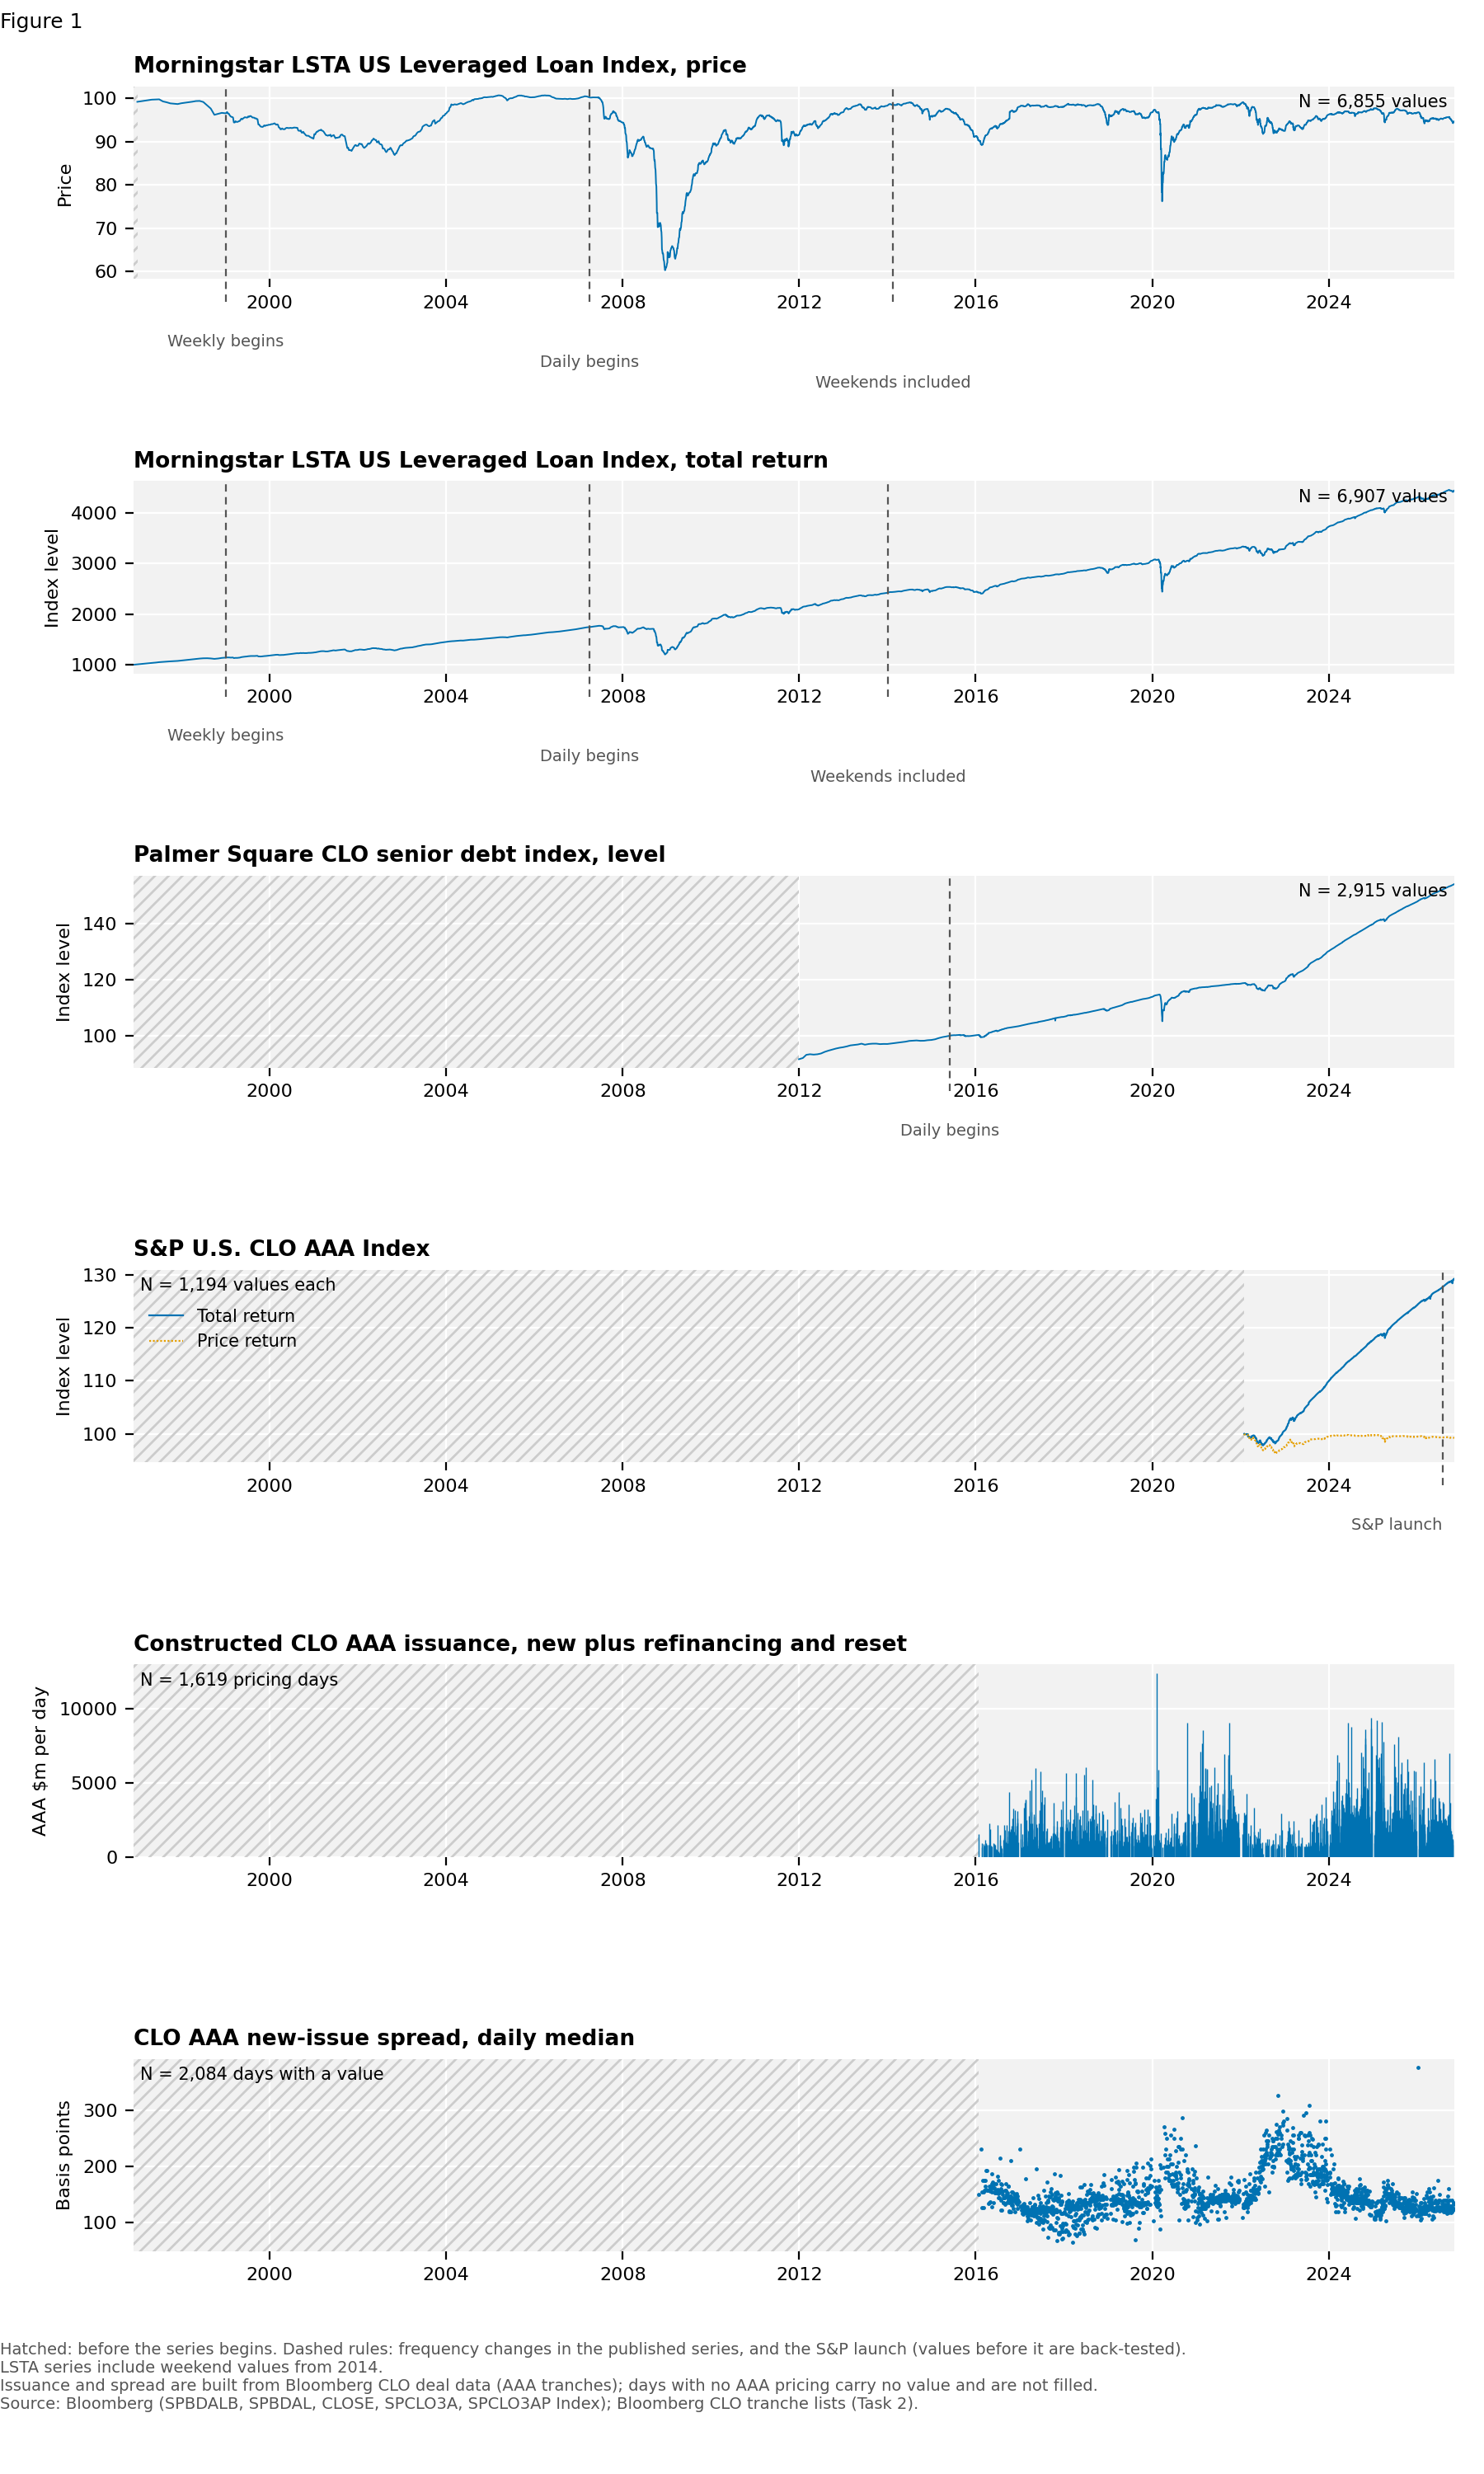
- Pulled the Morningstar LSTA leveraged loan index (price and total return), the Palmer Square CLO senior debt index (level), the S&P CLO AAA index (total return and price return), and built a CLO AAA issuance series (new plus refinancing and reset).
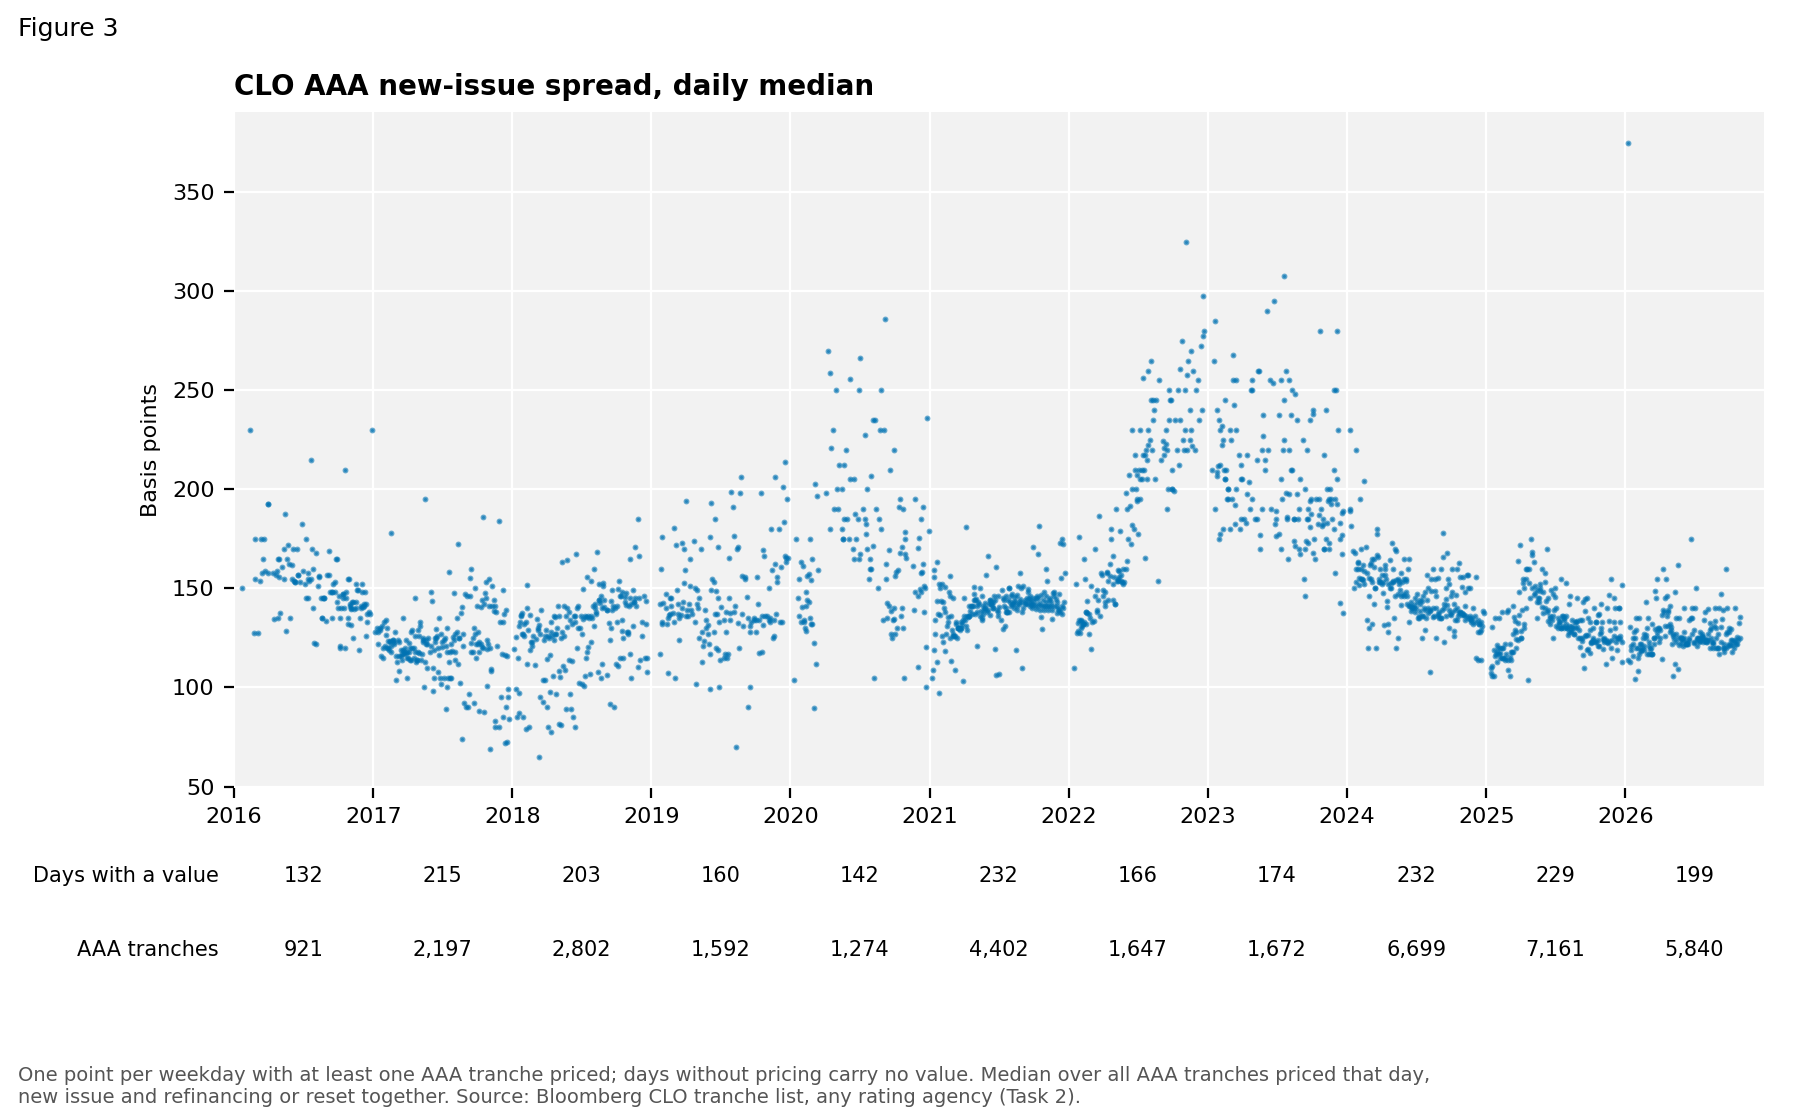
- Built a daily new-issue CLO AAA spread series: 2,084 days with a value, Jan 22, 2016 to Oct 30, 2026 (see Task 3, figure 3).
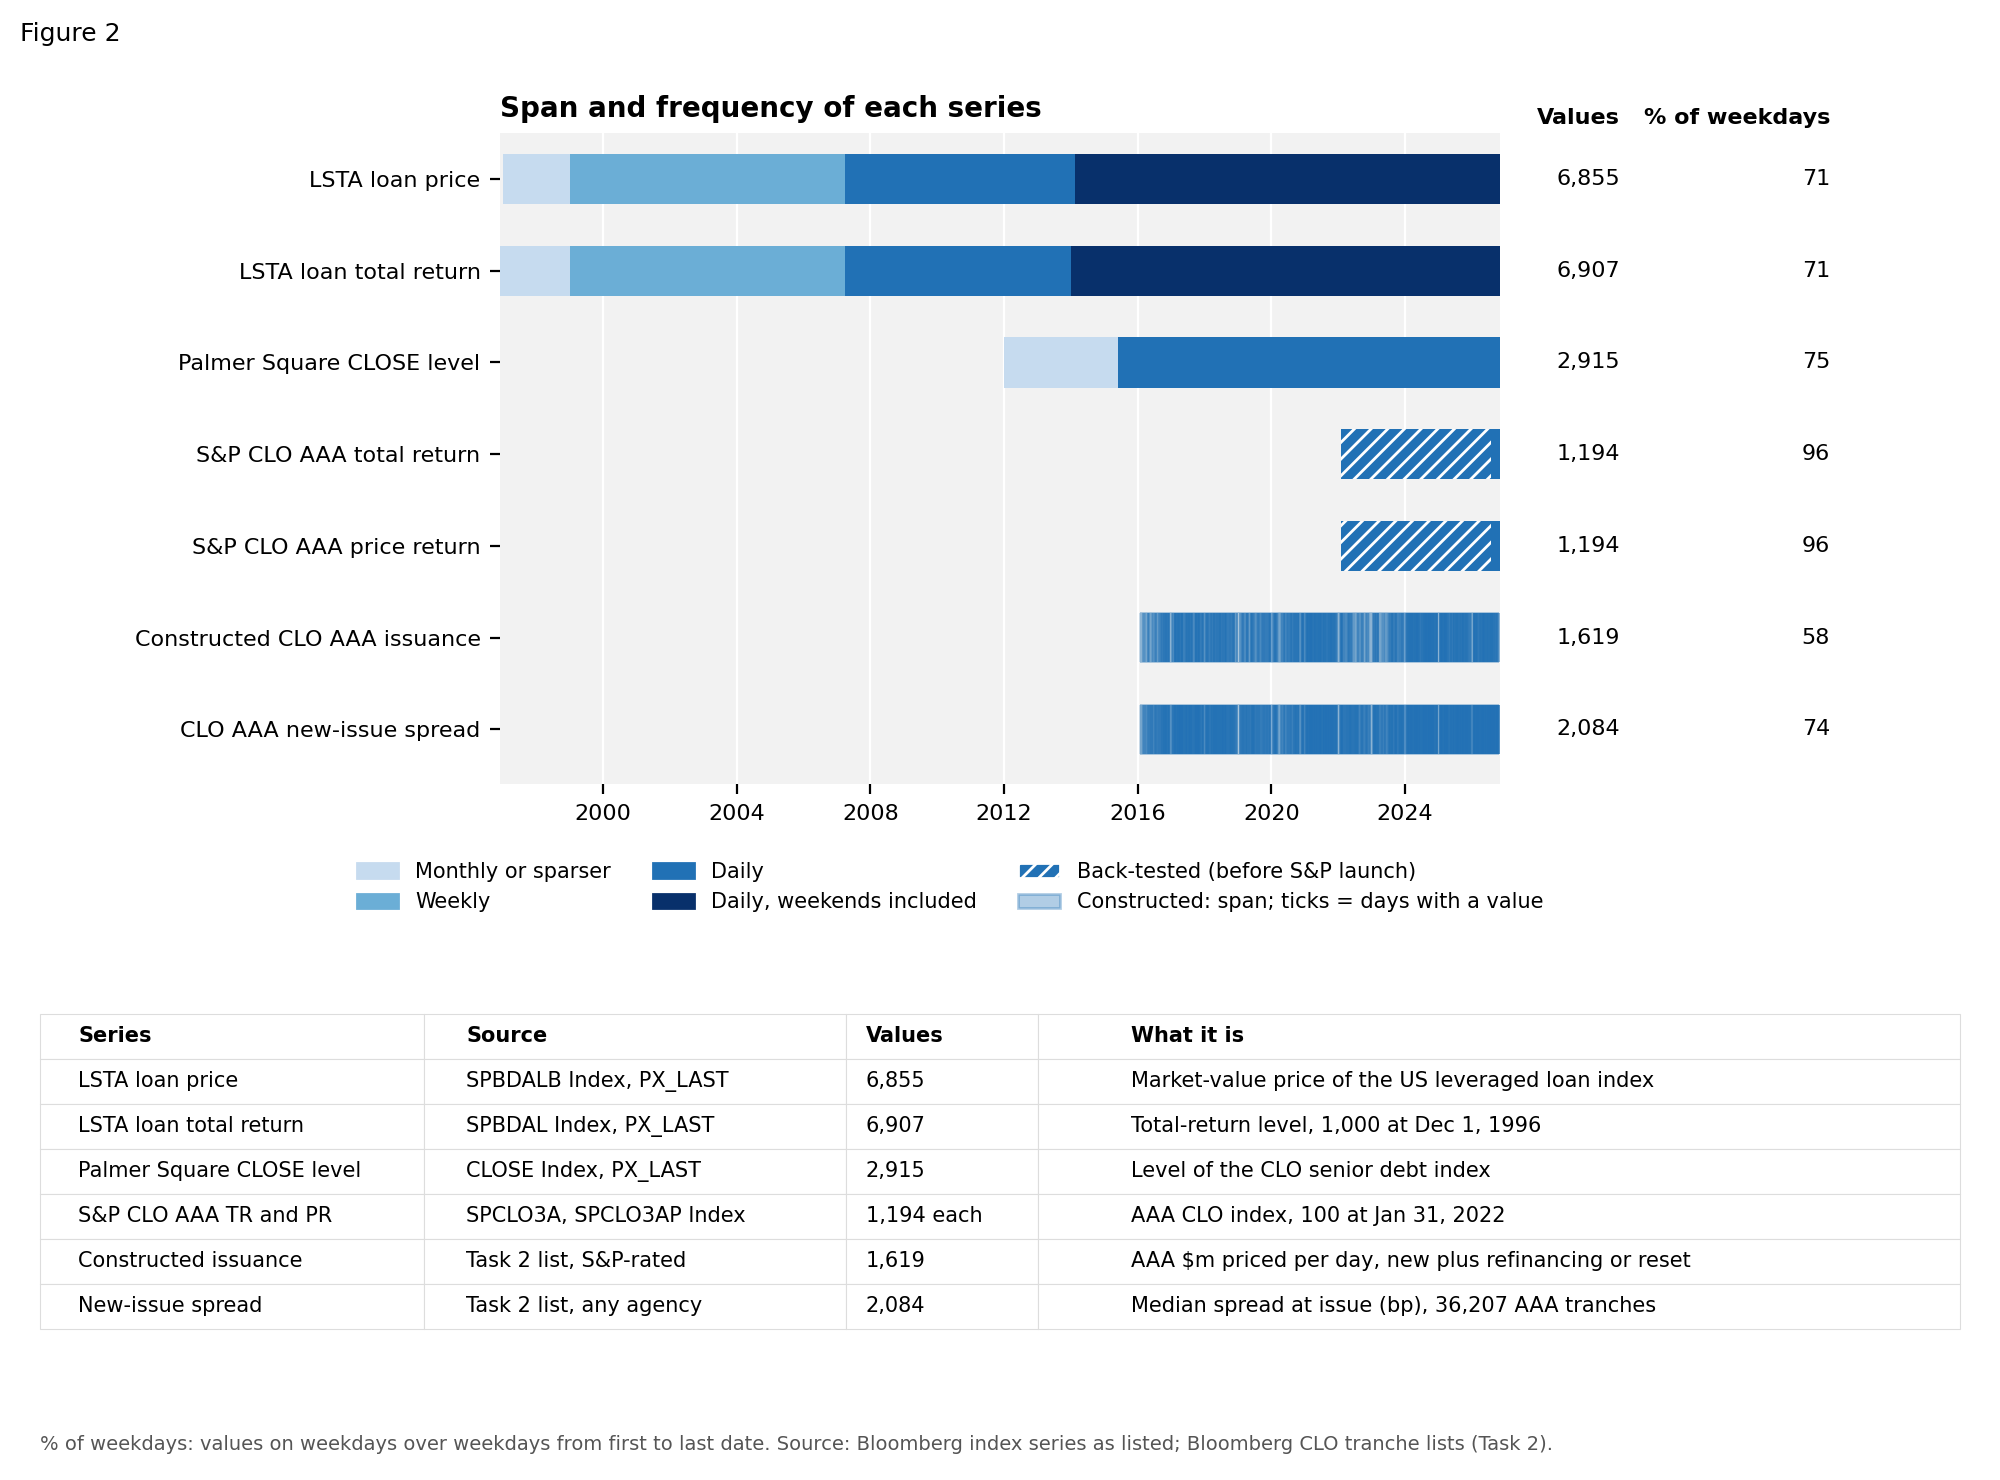
- Checked each series for its start date, its frequency changes and its share of weekdays with a value (see Task 3, figure 1 and Task 3, figure 2).
- Both LSTA series switch from weekdays to weekends included in 2014.
- Still to do: one file per series and the series log.
Task 4: report
- Not started. One-page report on how the work was done, with rough minutes per task.
Task 5: loan prices
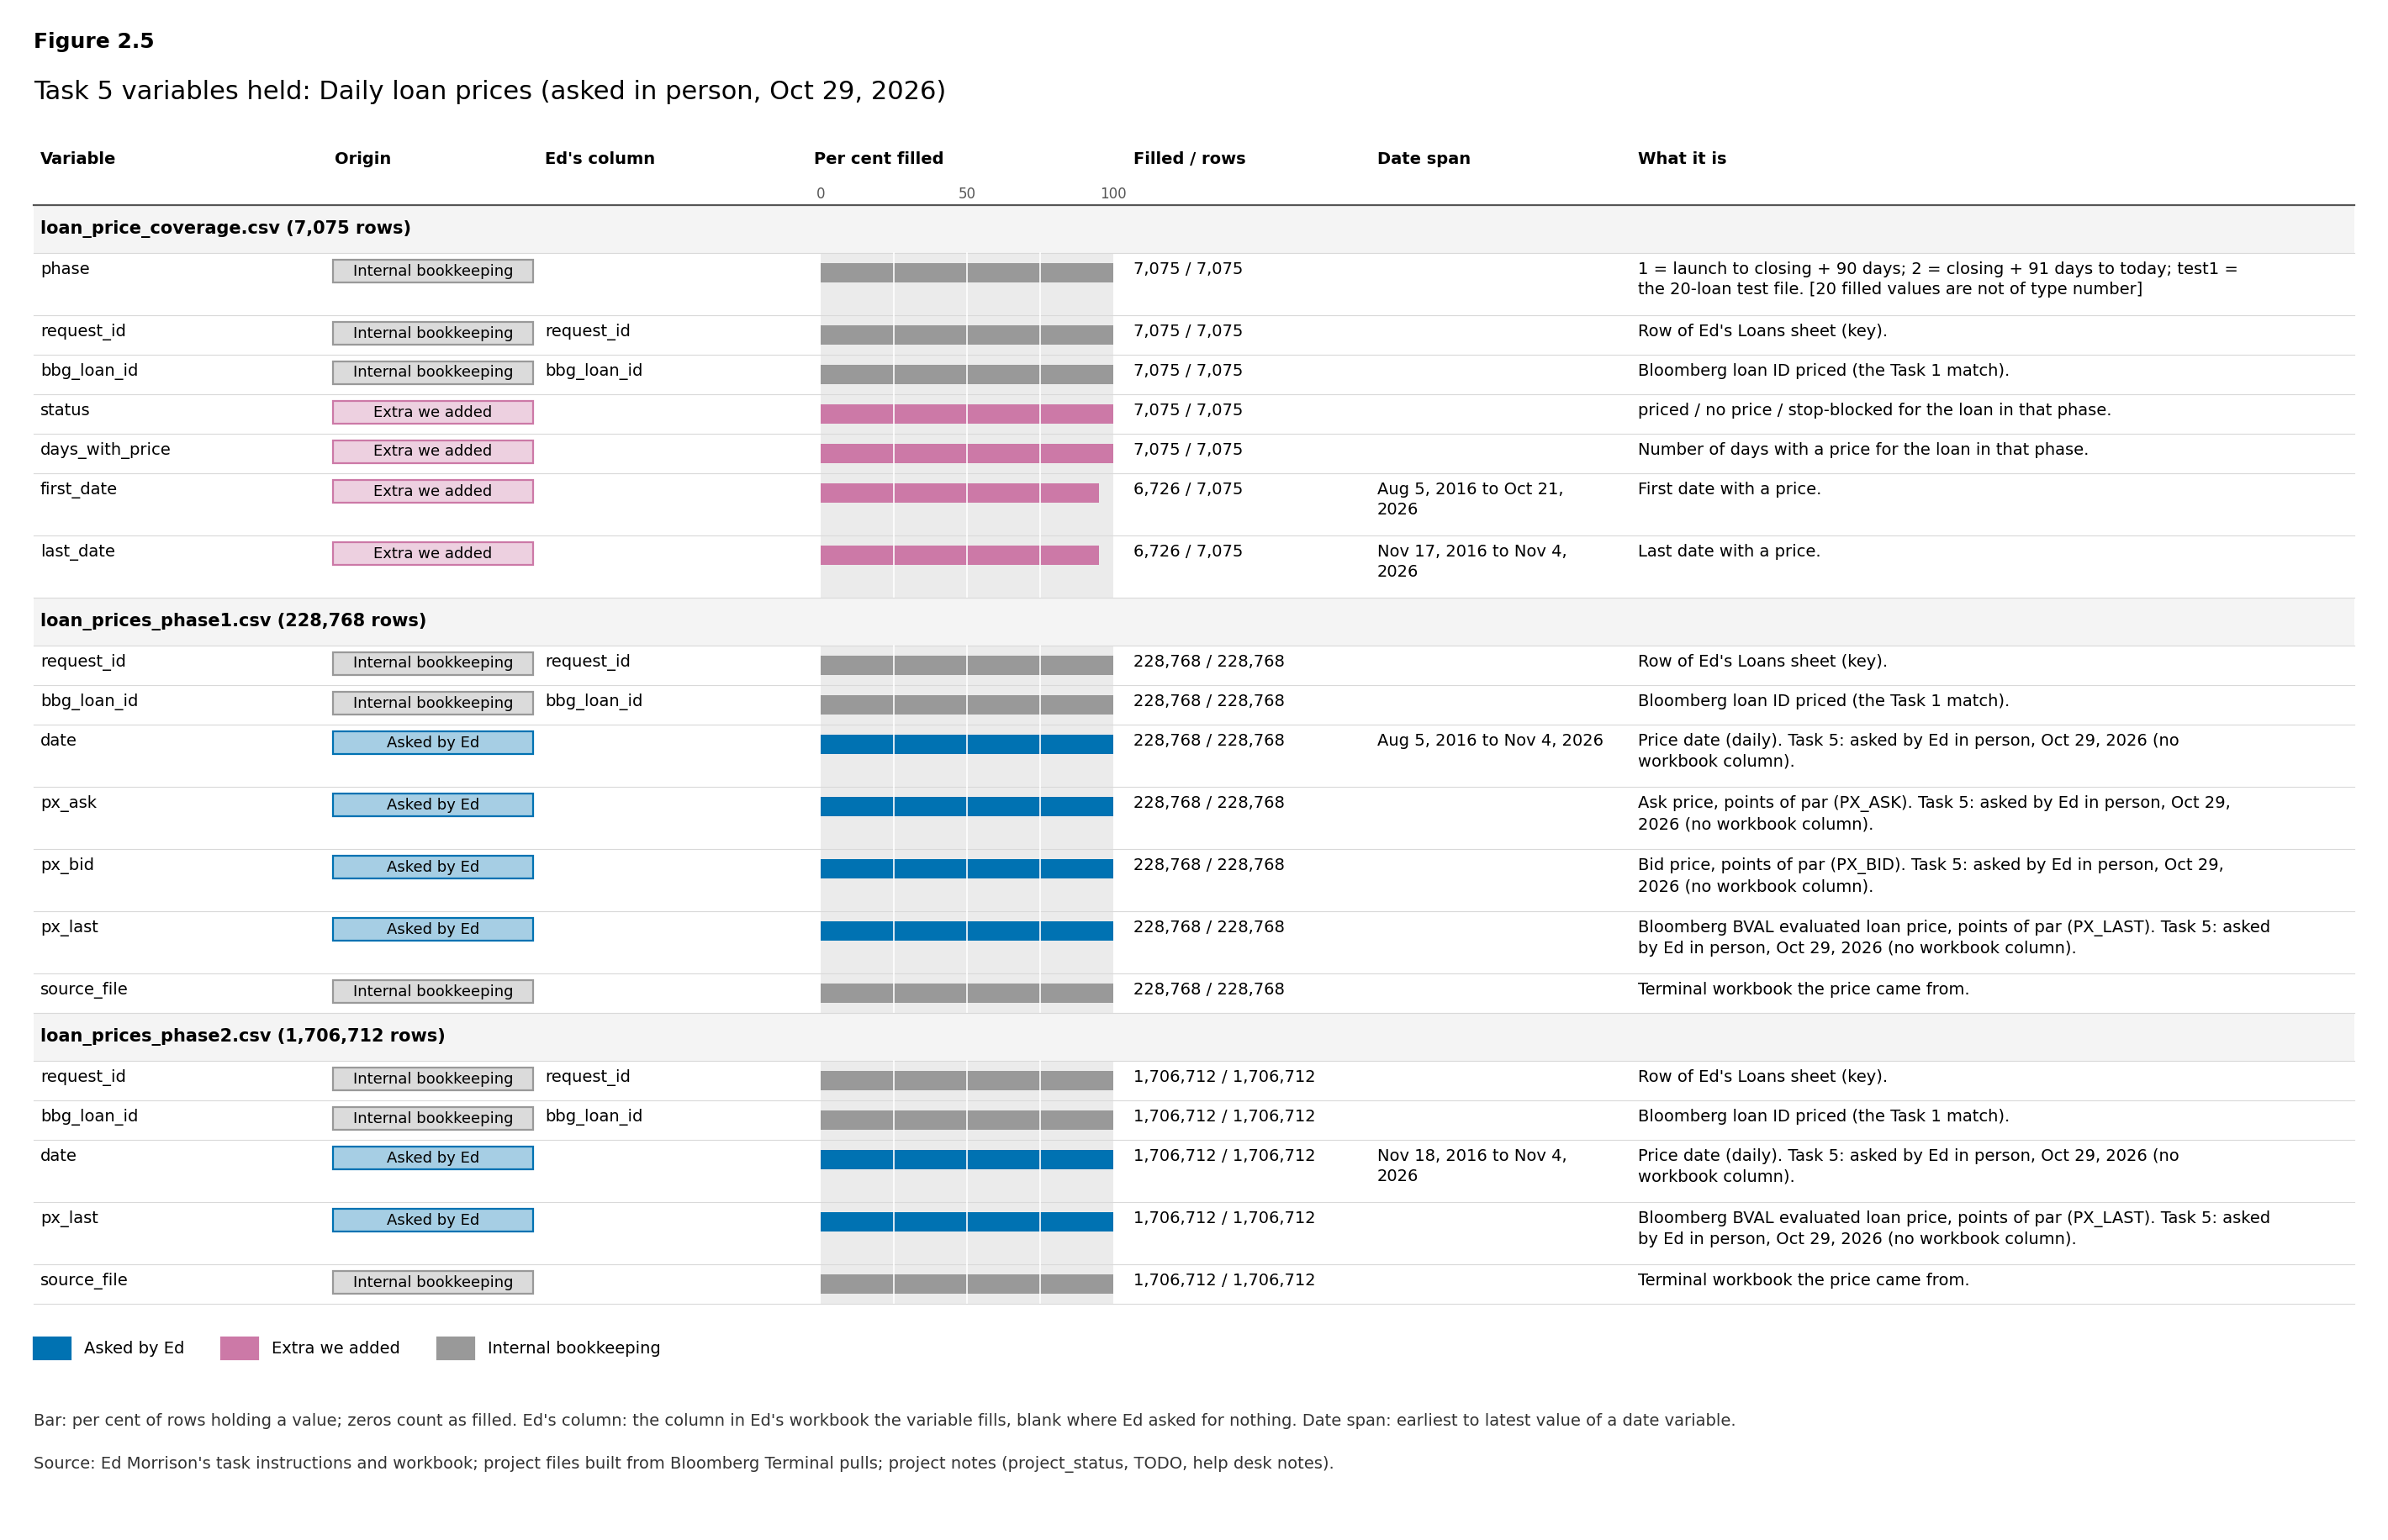
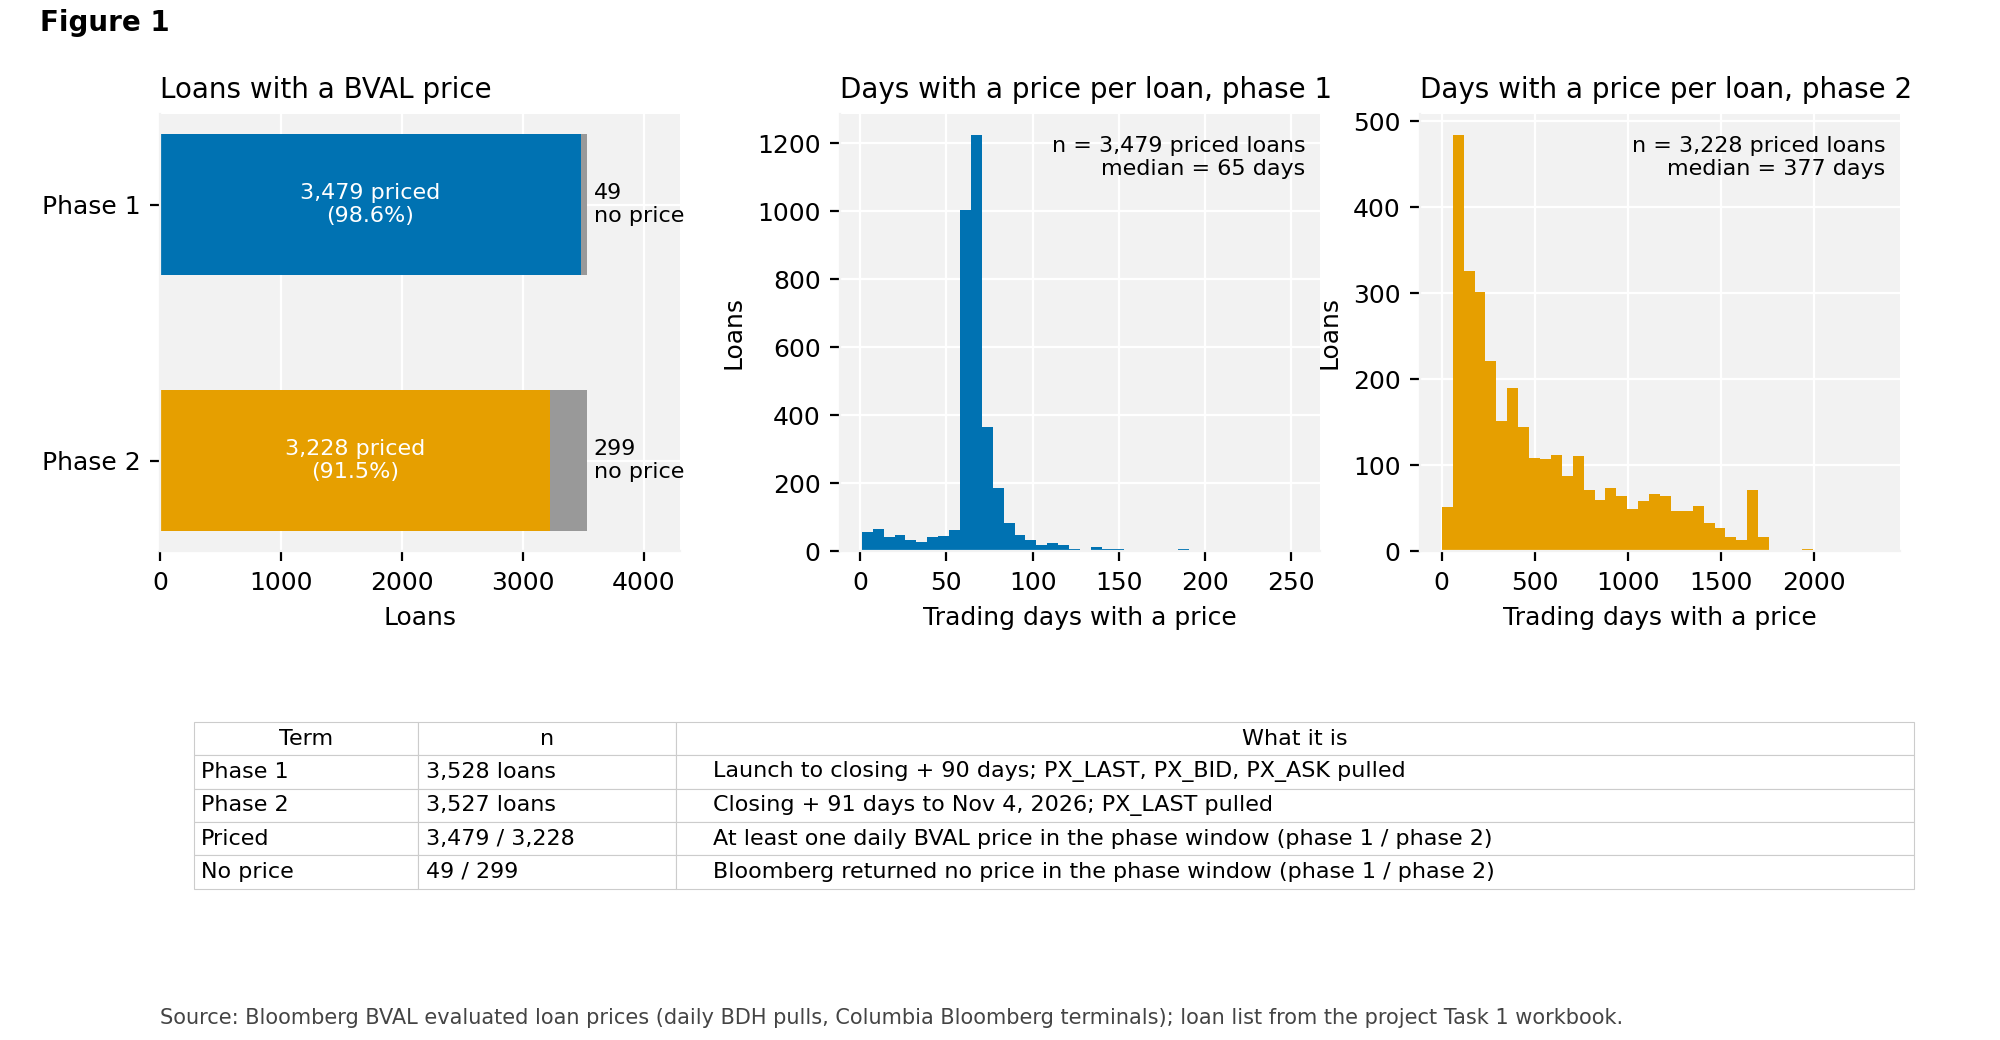
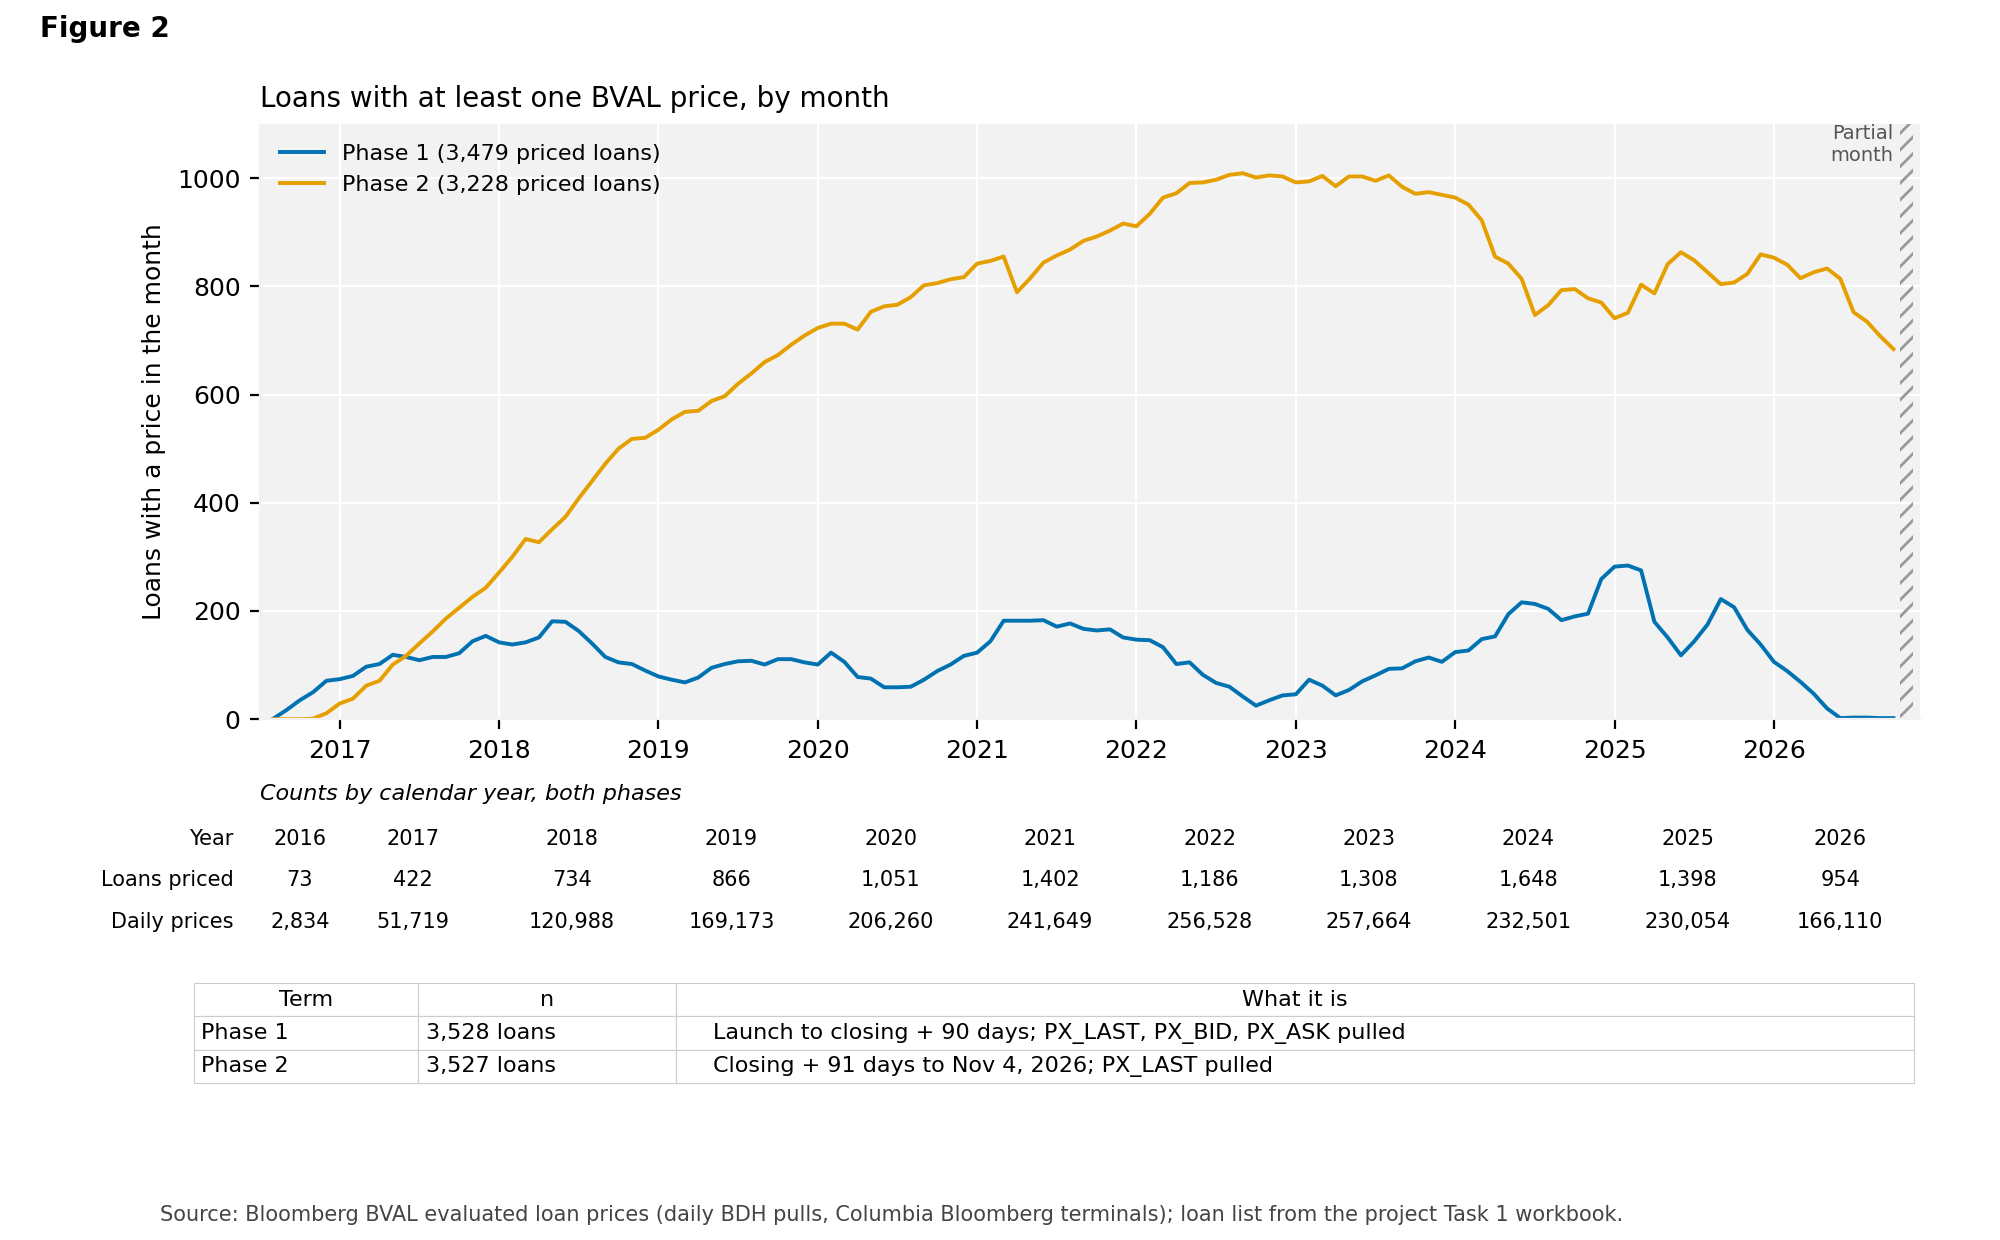
- Pulled daily BVAL prices (Bloomberg's evaluated loan price) for each loan in two windows: phase 1 runs from launch to 90 days after closing, phase 2 from 91 days after closing to Nov 4, 2026.
- 3,479 of 3,528 loans have a phase 1 price (98.6%) and 3,228 of 3,527 have a phase 2 price (91.5%). See Task 5, figure 1.
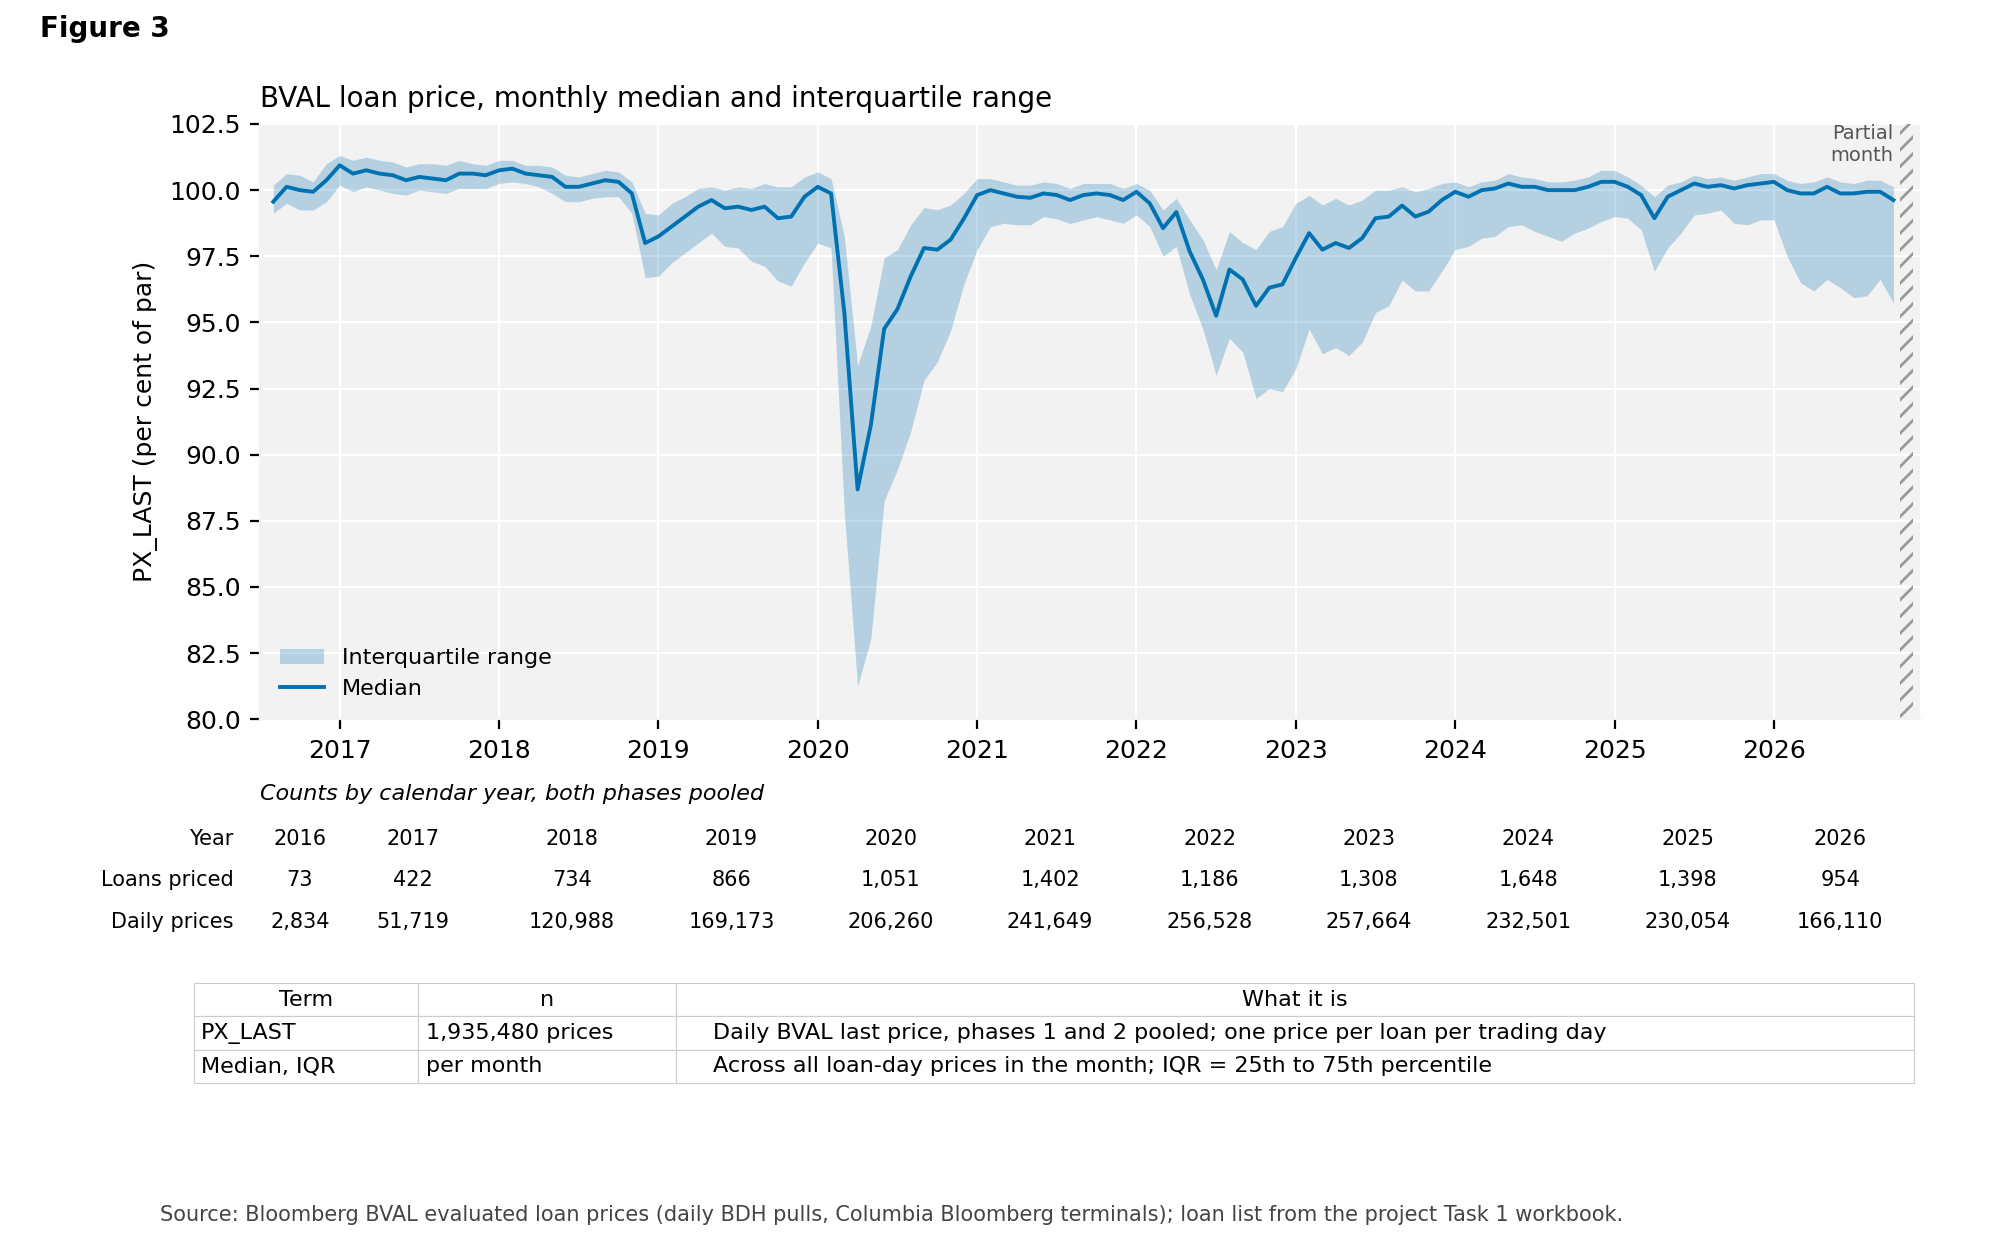
- In all, 1,935,480 daily prices from Aug 5, 2016 to Nov 4, 2026 (see Task 5, figure 2).
- Plotted the monthly median and spread of the price, in per cent of par (see Task 5, figure 3).
- BVAL was the only price source that returned history for the loans tested.
Caveats
- Task 2 counts are CUSIPs, not classes. The 144A, Reg S and AI pieces of one class are separate rows, so about 16,400 classes sit behind the 38,534 CUSIPs.
- There is no CLO AAA discount margin index. The Palmer Square index is available as a price level only; its discount margin, and CLOIE, need a paid entitlement.
- There is no tranche spread history. Bloomberg returned none for the CLO AAA tranches tested.
- The Task 3 issuance series is still built from the S&P-only list (16,658 CUSIPs, to Oct 23, 2026). The spread series uses the six-agency list (36,207 CUSIPs, to Oct 30, 2026).
- Dated flex history is not in the Task 1 file: the column is empty for all 3,594 loans.
- The January 2022 LIBOR to SOFR rule on the Task 2, figure 2 spread chart is an assumed date, not read from the data.
- The Jan 8, 2026 spread in Task 3, figure 3 (375 bp, 3 CUSIPs) is unchecked.
- BVAL prices above 110 (350 of the 1,935,480, maximum 156.21) need a check of the quoting convention before any analysis uses them.
Next steps
- Ed's workbook copy: CLO tranches sheet from the Task 2 list (38,534 rows, Ed's 14 columns).
- Ed's workbook copy: Loans sheet from the Task 1 match file (3,594 rows).
- Series log sheet and one file per series (Task 3).
- Task 4 report (Task 4).
- Look again at the 79 loans not found (Task 1, figure 1): a looser name search in Python, plus the Bloomberg answer on name search.
- Review the 798 loans where the tranche does not fit the size band (Task 1, figure 3) and the loan price coverage per loan (Task 5, figure 1).
- Save the Bloomberg help desk notes as a text file.